Enable Test Intelligence
Test Intelligence (TI) improves unit test time by running only the unit tests required to confirm the quality of the code changes that triggered the build. To learn more about how Test Intelligence works, go to Get started with Test Intelligence.
The Run Tests step executes one or more test on a container image. You must add the Run Tests step to a pipeline's Build stage to enable Test Intelligence on that pipeline. The first time you enable Test Intelligence on a repo, you must use a webhook-based PR trigger to generate an initial call graph, which sets the baseline for intelligent test selection in future builds.
You can also enable test splitting for Test Intelligence to further optimize your tests.
Requirements
To enable Test Intelligence, you need a supported codebase and a CI pipeline with a Build stage that is connected to the codebase and build infrastructure.
Supported codebases
Test Intelligence is available for the following codebases:
- Java
- Kotlin
- .NET Core: Test Intelligence for .NET is behind the Feature Flag
TI_DOTNET. Contact Harness Support to enable the feature. - Scala
Prepare your pipeline
Make sure you have a CI pipeline with a Build stage that is connected to your codebase. If you haven't created a pipeline before, go to CI pipeline creation overview.
To add a Build stage to an existing pipeline:
- Go to the pipeline you want to edit.
- In the Pipeline Studio, select Add Stage, and then select Build.
- Enter a Stage Name, enable Clone Codebase, and then select Set Up Stage.
- On the Build stage's Infrastructure tab, set up the build infrastructure.
To edit codebase configuration for existing pipelines, select Codebase while viewing the pipeline in the Pipeline Studio. For more information about codebase configuration, go to Create and configure a codebase.
Enable Test Intelligence
Use these steps to configure the Run Tests step and generate an initial call graph.
In the Pipeline Studio, select the Build stage, and then select the Execution tab.
Select Add Step, select Add Step again, and then select Run Tests from the Step Library.
At minimum, you must configure the following settings to run tests with Test Intelligence:
- Name
- Container Registry
- Image
- Language
- Build Tool
- Build Arguments
- Test Report Paths
- Run Only Selected Tests
- Packages: Leave blank or provide a comma-separated list of source code package prefixes
- Test Annotations: Leave blank or provide a comma-separated list of test annotations to use in unit testing. If you do not provide a list of test annotations, the default is
org.junit.Test, org.junit.jupiter.api.Test, org.testing.annotations.Test. - Namespaces: For .NET C# only, supply a comma-separated list of namespace prefixes that you want to test.
For more information about these settings, and other Run Tests step settings, go to the Run Tests step settings reference.
YAML example
The following YAML example is for a pipeline that runs Test Intelligence on the Dubbo open-source project. You can use this YAML template to set up a pipeline with a Run Tests step. Make sure you complete the remaining steps in this procedure to generate the initial call graph.
pipeline:
    name: ti-dubbo
    identifier: tidubbo
    properties:
        ci:
            codebase:
                connectorRef: account.howdi
                repoName: dubbo
                build: <+input>
    stages:
        - stage:
              name: unit-test
              identifier: unitteststi
              type: CI
              spec:
                  cloneCodebase: true
                  execution:
                      steps:
                          - step:
                                type: RunTests
                                name: runTestsWithIntelligence
                                identifier: runTestsWithIntelligence
                                spec:
                                    connectorRef: account.GCR
                                    image: maven:3-openjdk-8
                                    args: test -Dmaven.test.failure.ignore=true -DfailIfNoTests=false
                                    buildTool: Maven
                                    language: Java
                                    packages: org.apache.dubbo,com.alibaba.dubbo
                                    runOnlySelectedTests: true
                                    reports:
                                        type: JUnit
                                        spec:
                                            paths:
                                                - "**/*.xml"
                                    resources:
                                        limits:
                                            memory: 2Gi
                                            cpu: 2000m
                                timeout: 60m
                  serviceDependencies: []
                  infrastructure:
                      type: KubernetesDirect
                      spec:
                          connectorRef: Kubernetes_Quickstart
                          namespace: harness-delegate
              variables: []
    projectIdentifier: CI_Examples
    orgIdentifier: default
    description: TI for open source project dubbo
    tags: {}
- Select Apply Changes to save the step settings, and then select Save to save the pipeline.
- The first time you enable Test Intelligence on a repo, you must run all tests to generate an initial call graph. This creates a baseline for test selection in future builds. To generate the initial call graph:
- Add a webhook trigger to the pipeline that listens for PRs to be opened against the pipeline's codebase.
- Open a PR against the pipeline's codebase. Make sure the build triggered by this PR runs all tests.
- Wait while the pipeline executes. To monitor the build's progress, go to Builds and select the build that the PR started.
- If the tests pass and the build succeeds, merge the PR.
View test reports
To view the test report, go to the Build details page and select Tests. The test report content is based on the tests you configured for the Run Tests step. In order for the Tests tab to show tests, your test reports must be in JUnit XML format. Harness parses test reports that are in JUnit XML format only.
Expand the sections below to learn more about the test report contents.
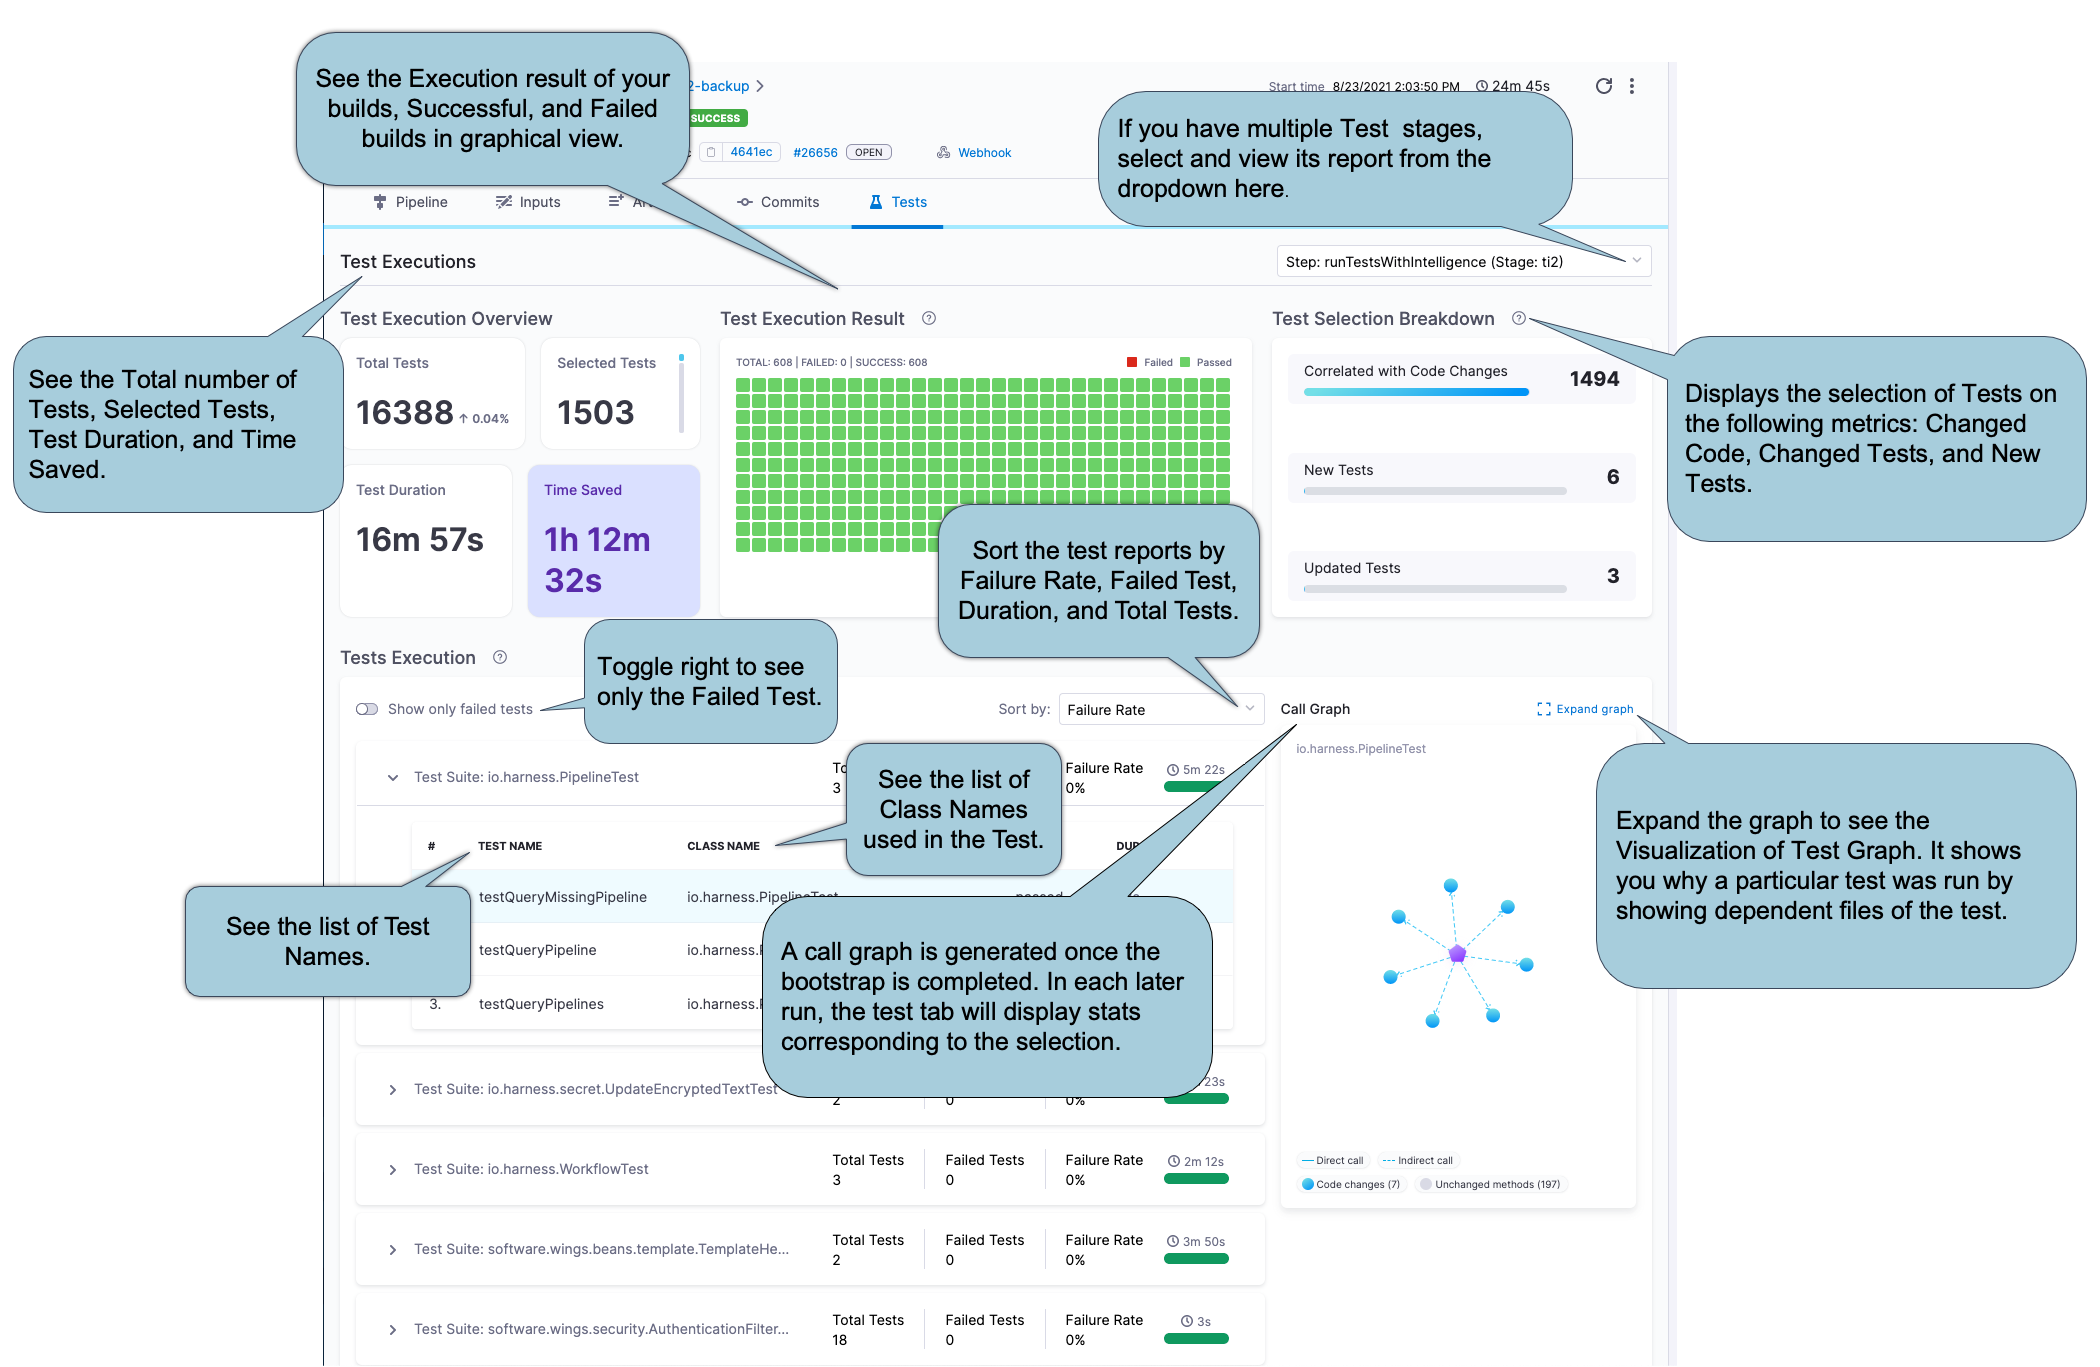
Test Execution Overview
Provides an overview of Total Tests, number of Selected Tests, total Duration of all tests, and Time Saved.
Duration reflects the sum of CPU time taken for all tests to complete. The values are collected as-is from the JUnit report, and they don't correspond with wall-clock time. In contrast, the pipeline execution time is a measure of wall-clock time. Therefore, it is possible that the Duration may exceed the total pipeline execution time.
Test Execution Result
Graphical representation of successful and failed tests.
Test Selection Breakdown
Test Intelligence analyzes changes to source files and test files in the codebase and then runs only the tests that are relevant to the detected changes. This section reports how many tests ran based on the different the types of code changes included in this build:
- Correlated with Code Changes: The number of tests that ran due to changes in the codebase.
- New Tests: The number of tests that ran because they are new.
- Updated Tests: The number of tests that ran because there was a change to the actual test code or content.
Test Execution
Detailed list of all tests, including class methods and test methods.
Initially, the list shows only failed tests. To see all tests, toggle Show all Tests.
You can sort the list by failure rate, duration, and total tests. You can also expand test suites to see details about individual tests in that suite.
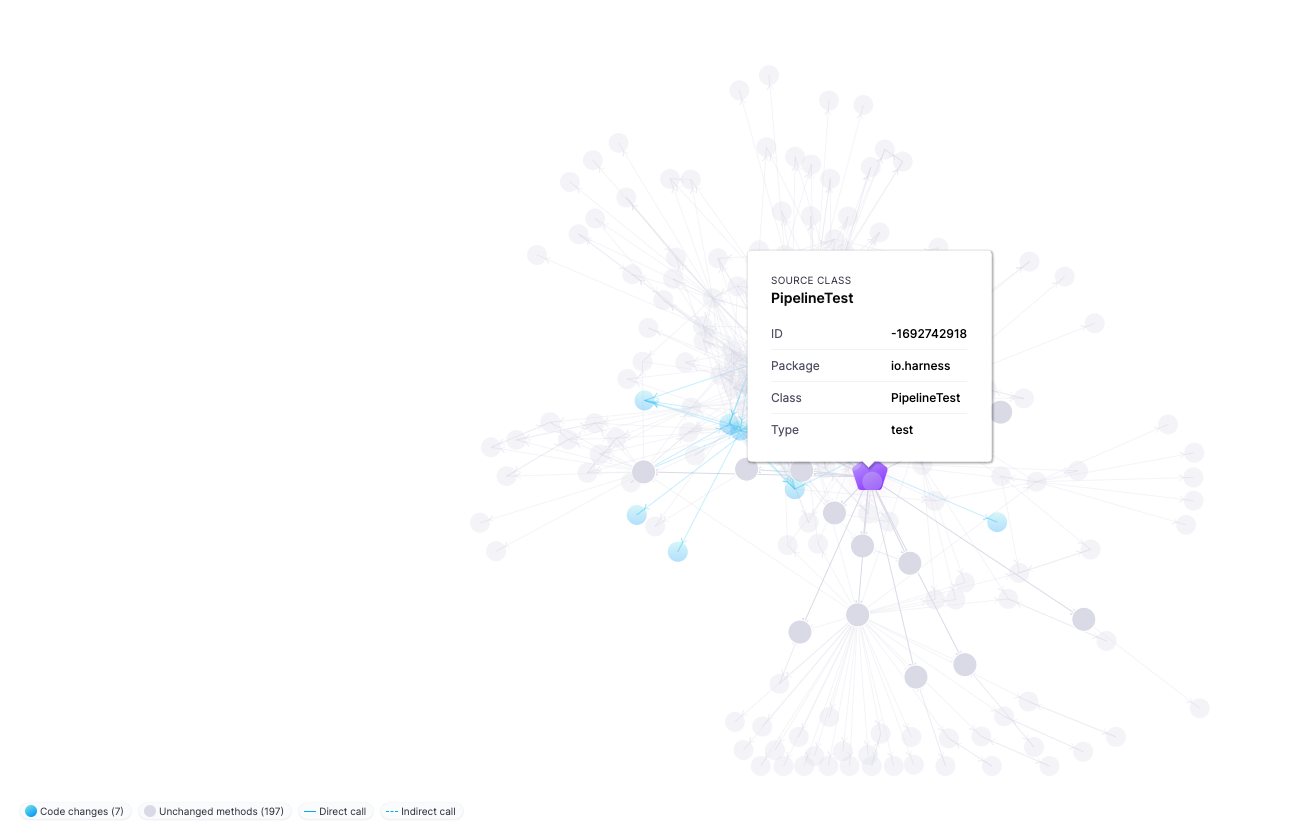
Call Graph
The first time you Enable Test Intelligence on a repo, you must use a webhook-based PR trigger to run all tests and generate the initial call graph. This creates a baseline for test selection in future builds; therefore, the initial call graph is not particularly useful. In subsequent builds, the call graph shows information about tests selected by Test Intelligence for that run.
Select Expand graph to view the Test Intelligence Visualization, which shows why a specific test was selected and the reason behind every test selection. Purple nodes represent tests. Select any test (purple node) to see all the classes and methods covered by that test. Blue nodes represent changes to classes and methods that caused Test Intelligence to select that test.
Enable parallelism (test splitting) for Test Intelligence
Similar to how you can use parallelism and split_tests to define test splitting in a Run step, you can enable parallelism and test splitting in your Run Tests steps to further reduce the time required for your tests to run.
With parallelism alone, you specify how you want Harness to divide the work for a step or stage. When you use parallelism and test splitting with Test Intelligence, Harness divides the work after test selection. This means that your Run Tests execution time is reduced by both test selection and parallelism.
Test Intelligence with test splitting demonstration
Suppose you have a pipeline that runs 100 tests, and each test takes about one second to run. Here's how TI and parallelism can reduce your test times:
- By default, without TI or parallelism, all 100 tests run in sequence, taking 100 seconds.
- With TI, test selection reduces the number of tests based on the detected changes. Supposing only 20 out of the 100 tests are required, the build with TI runs 20 tests in sequence, taking 20 seconds. This reduces test run time by 80%.
- With TI and parallelism, the selected tests are divided into a number of workloads. Supposing a maximum of four workloads and 20 selected tests, the 20 tests are split into four concurrently-running groups. It takes only five seconds to run the tests, reducing test run time by 95% compared to the default.
To enable parallelism for Test Intelligence, you must set a parallelism strategy on either the Run Tests step or the stage where you have the Run Tests step, and you must add the enableTestSplitting parameter to your Run Tests step's spec. You can also add the optional parameter testSplitStrategy.
Go to the pipeline where you want to enable parallelism for Test Intelligence.
Define the parallelism strategy on either the stage where you have the Run Tests step or on the Run Tests step itself. You must include
strategyandparallelism. Other options, such asmaxConcurrencyare optional. For example:strategy:
parallelism: 5You can do this in either the visual or YAML editor. In the visual editor, Parallelism is found under Looping Strategy in the stage's or step's Advanced settings.
cautionIf you use step-level parallelism, you must ensure that your test runners won't interfere with each other, because all parallel steps work on the same directory.
Switch to the YAML editor, if you were not already using it.
Find the
RunTestsstep, and then find thespecsection.Add the
enableTestSplittingparameter and the optionaltestSplitStrategyparameter. You must setenableTestSplittingtotrue.The
testSplitStrategyparameter is optional. If you include it, you can choose eitherTestCountorClassTiming. Class timing uses test times from previous runs to determine how to split the test workload for the current build. Test count uses simple division to split the tests into workloads. The default isClassTimingif you omit this parameter.The maximum number of workloads is determined by the parallelism
strategyyou specified on the step or stage. For example, if you setparallelism: 5, tests are split into a maximum of five workloads.Here is a truncated YAML example of a Run Tests step with
enableTestSplittingandtestSplitStrategy:- step:
type: RunTests
name: Run Test With Intelligence
identifier: run-tests-with-intelligence
spec:
enableTestSplitting: true
testSplitStrategy: ClassTimingSave and run your pipeline.
Note that while parallelism for Test Intelligence can improve the total time it takes to run all tests, some tests may still take a long time to run if, by their nature, they are intensive, long-running tests.
YAML example: Build stage with Test Intelligence and test splitting
        - stage:
              name: unit-test
              identifier: unitteststi
              type: CI
              spec:
                  cloneCodebase: true
                  execution:
                      steps:
                          - step:
                                type: RunTests
                                name: runTestsWithIntelligence
                                identifier: runTestsWithIntelligence
                                spec:
                                    enableTestSplitting: true
                                    testSplitStrategy: ClassTiming
                                    connectorRef: account.GCR
                                    image: maven:3-openjdk-8
                                    args: test -Dmaven.test.failure.ignore=true -DfailIfNoTests=false
                                    buildTool: Maven
                                    language: Java
                                    packages: org.apache.dubbo,com.alibaba.dubbo
                                    runOnlySelectedTests: true
                                    reports:
                                        type: JUnit
                                        spec:
                                            paths:
                                                - "**/*.xml"
                                    resources:
                                        limits:
                                            memory: 2Gi
                                            cpu: 2000m
                                timeout: 60m
                  serviceDependencies: []
                  infrastructure:
                      type: KubernetesDirect
                      spec:
                        connectorRef: Kubernetes_Quickstart
                        namespace: harness-delegate
              variables: []
              strategy:
                parallelism: 3
Troubleshooting
You may encounter the following issues when using Test Intelligence with Maven.
pom.xml includes argLine
If your pom.xml contains argLine, you must update the Java Agent as follows:
Before:
<argLine> something
</argLine>
After:
<argLine> something -javaagent:/addon/bin/java-agent.jar=/addon/tmp/config.ini
</argLine>
Jacoco/Surefire/Failsafe
If you're using Jacoco, Surefire, or Failsafe, make sure the forkCount is not set to 0.
For example, the following configuration in pom.xml removes the forkCount setting and applies useSystemClassLoader as a workaround:
<plugin>
    <groupId>org.apache.maven.plugins</groupId>
    <artifactId>maven-surefire-plugin</artifactId>
    <version>2.22.1</version>
    <configuration>
        <!--  <forkCount>0</forkCount> -->
        <useSystemClassLoader>false</useSystemClassLoader>
    </configuration>
</plugin>