Monitor deployments and services in CD dashboards
This topic describes how you can use DORA and other advanced metrics for deployments and services in CD Dashboards.
Deployments and Services can be measured within the CD module (Overview and Services in the Deployments module), and using the Harness Platform Dashboards (Dashboards). Platform Dashboards also let you create highly advanced custom dashboards.
Overview and Services Dashboards
Deployments are tracked in the Overview dashboard and Services are tracked in the Services dashboard.
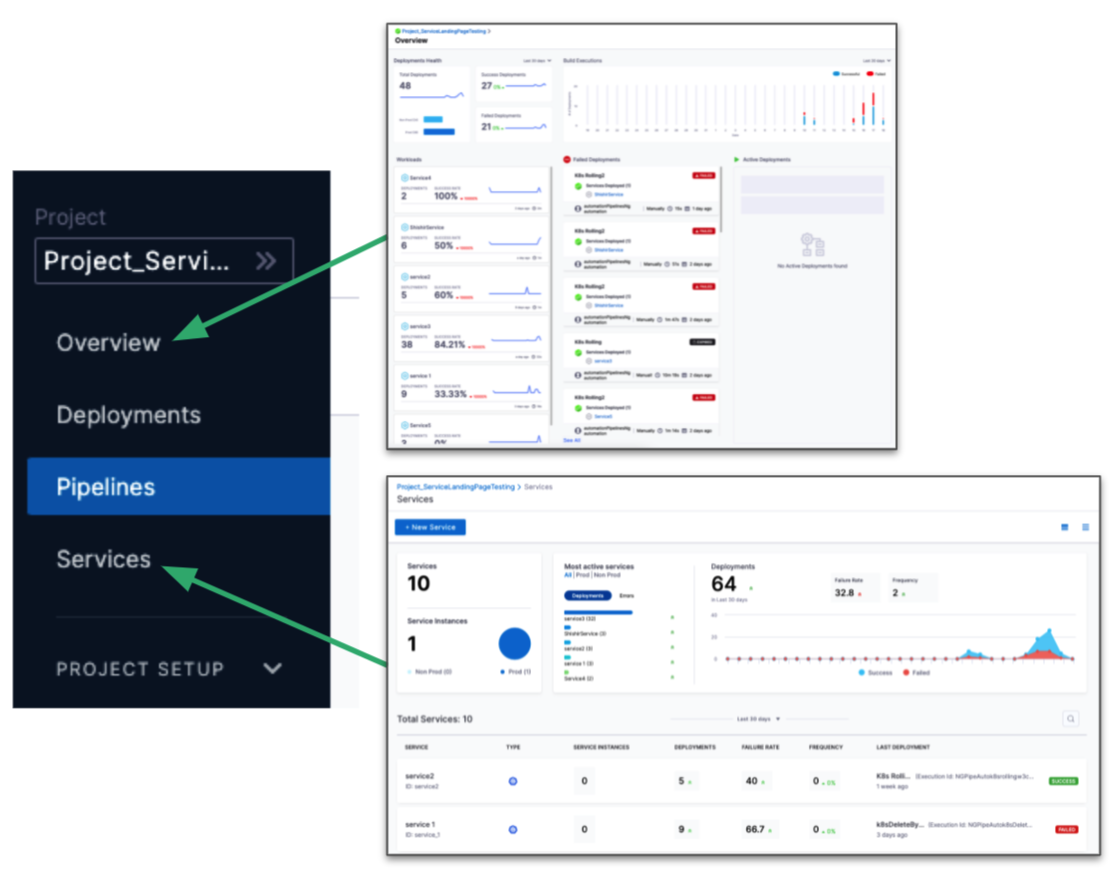
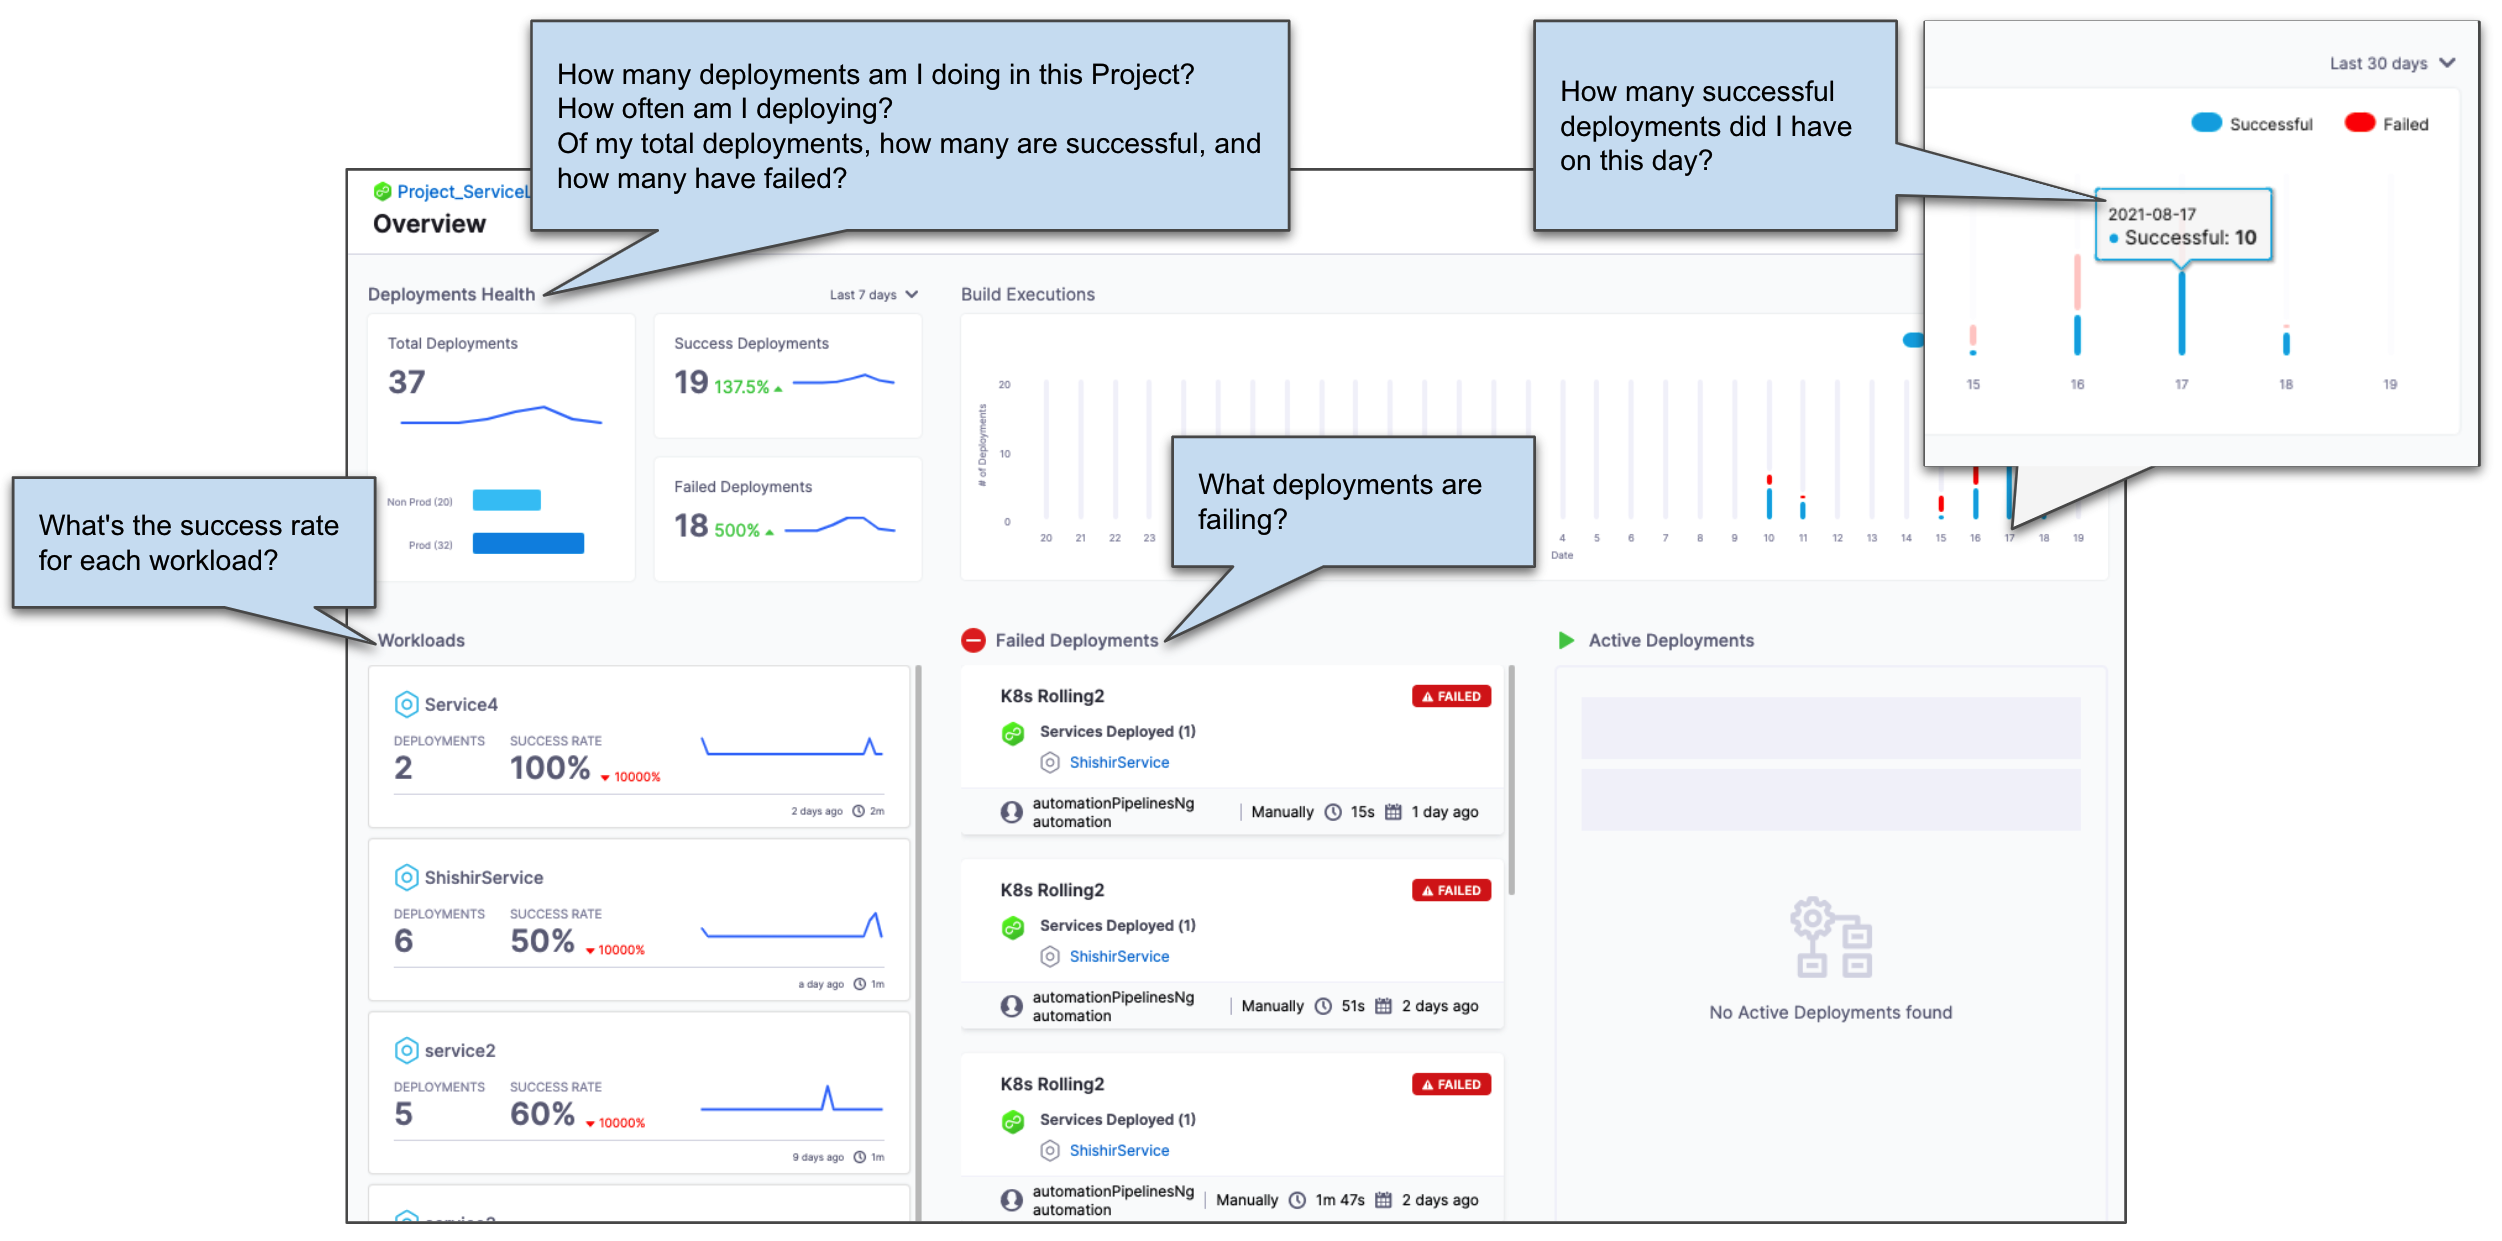
Overview Dashboard
The Overview dashboard provides status for deployments and workloads and an overall Deployments Health metric:
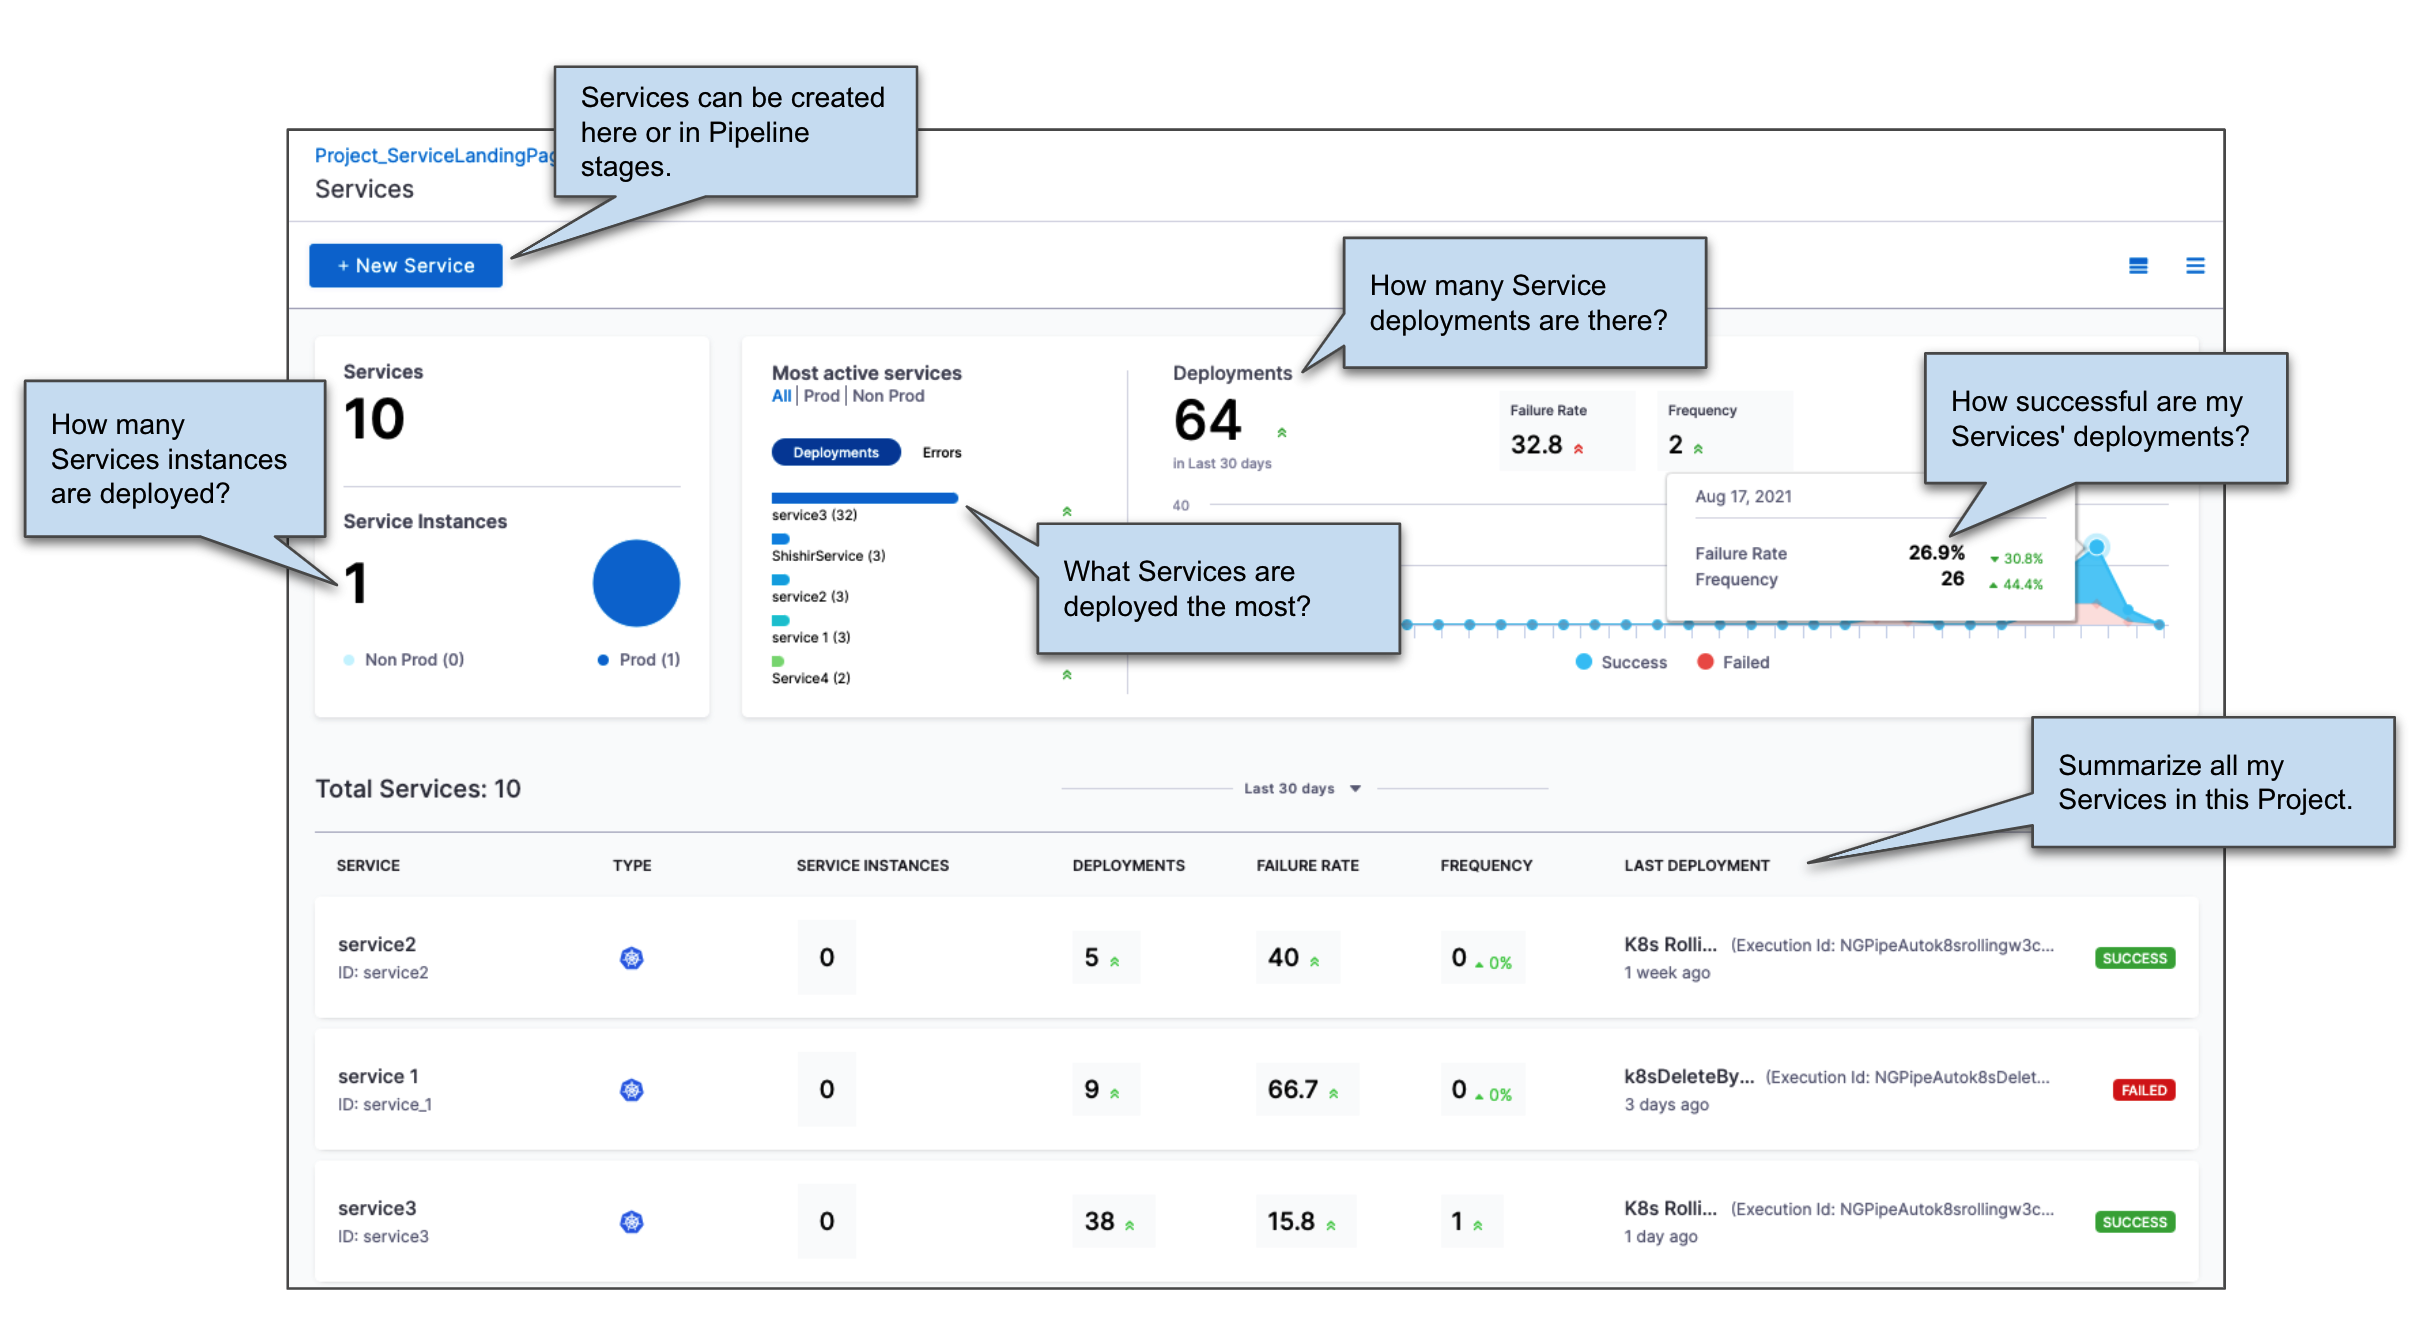
Services Dashboard
What is a Harness Service? A Harness Service is both a logical and configuration view of the services you deploy.
The logical view is immutable and contains a name, unique Id, and description. The configuration view can be changed with each stage of a Pipeline and contains the artifacts, manifests, repo URLs, etc for that stage's deployment of the Service.
What is a Service instance in Harness? Harness licensing is determined by the service instances you deploy. A service instance is when you use Harness to deploy the underlying infrastructure for the instance. For example, an instance of a Kubernetes workload where Harness creates the pods.
The Services dashboard provides an overview of all the Services and Service instances in your Project:
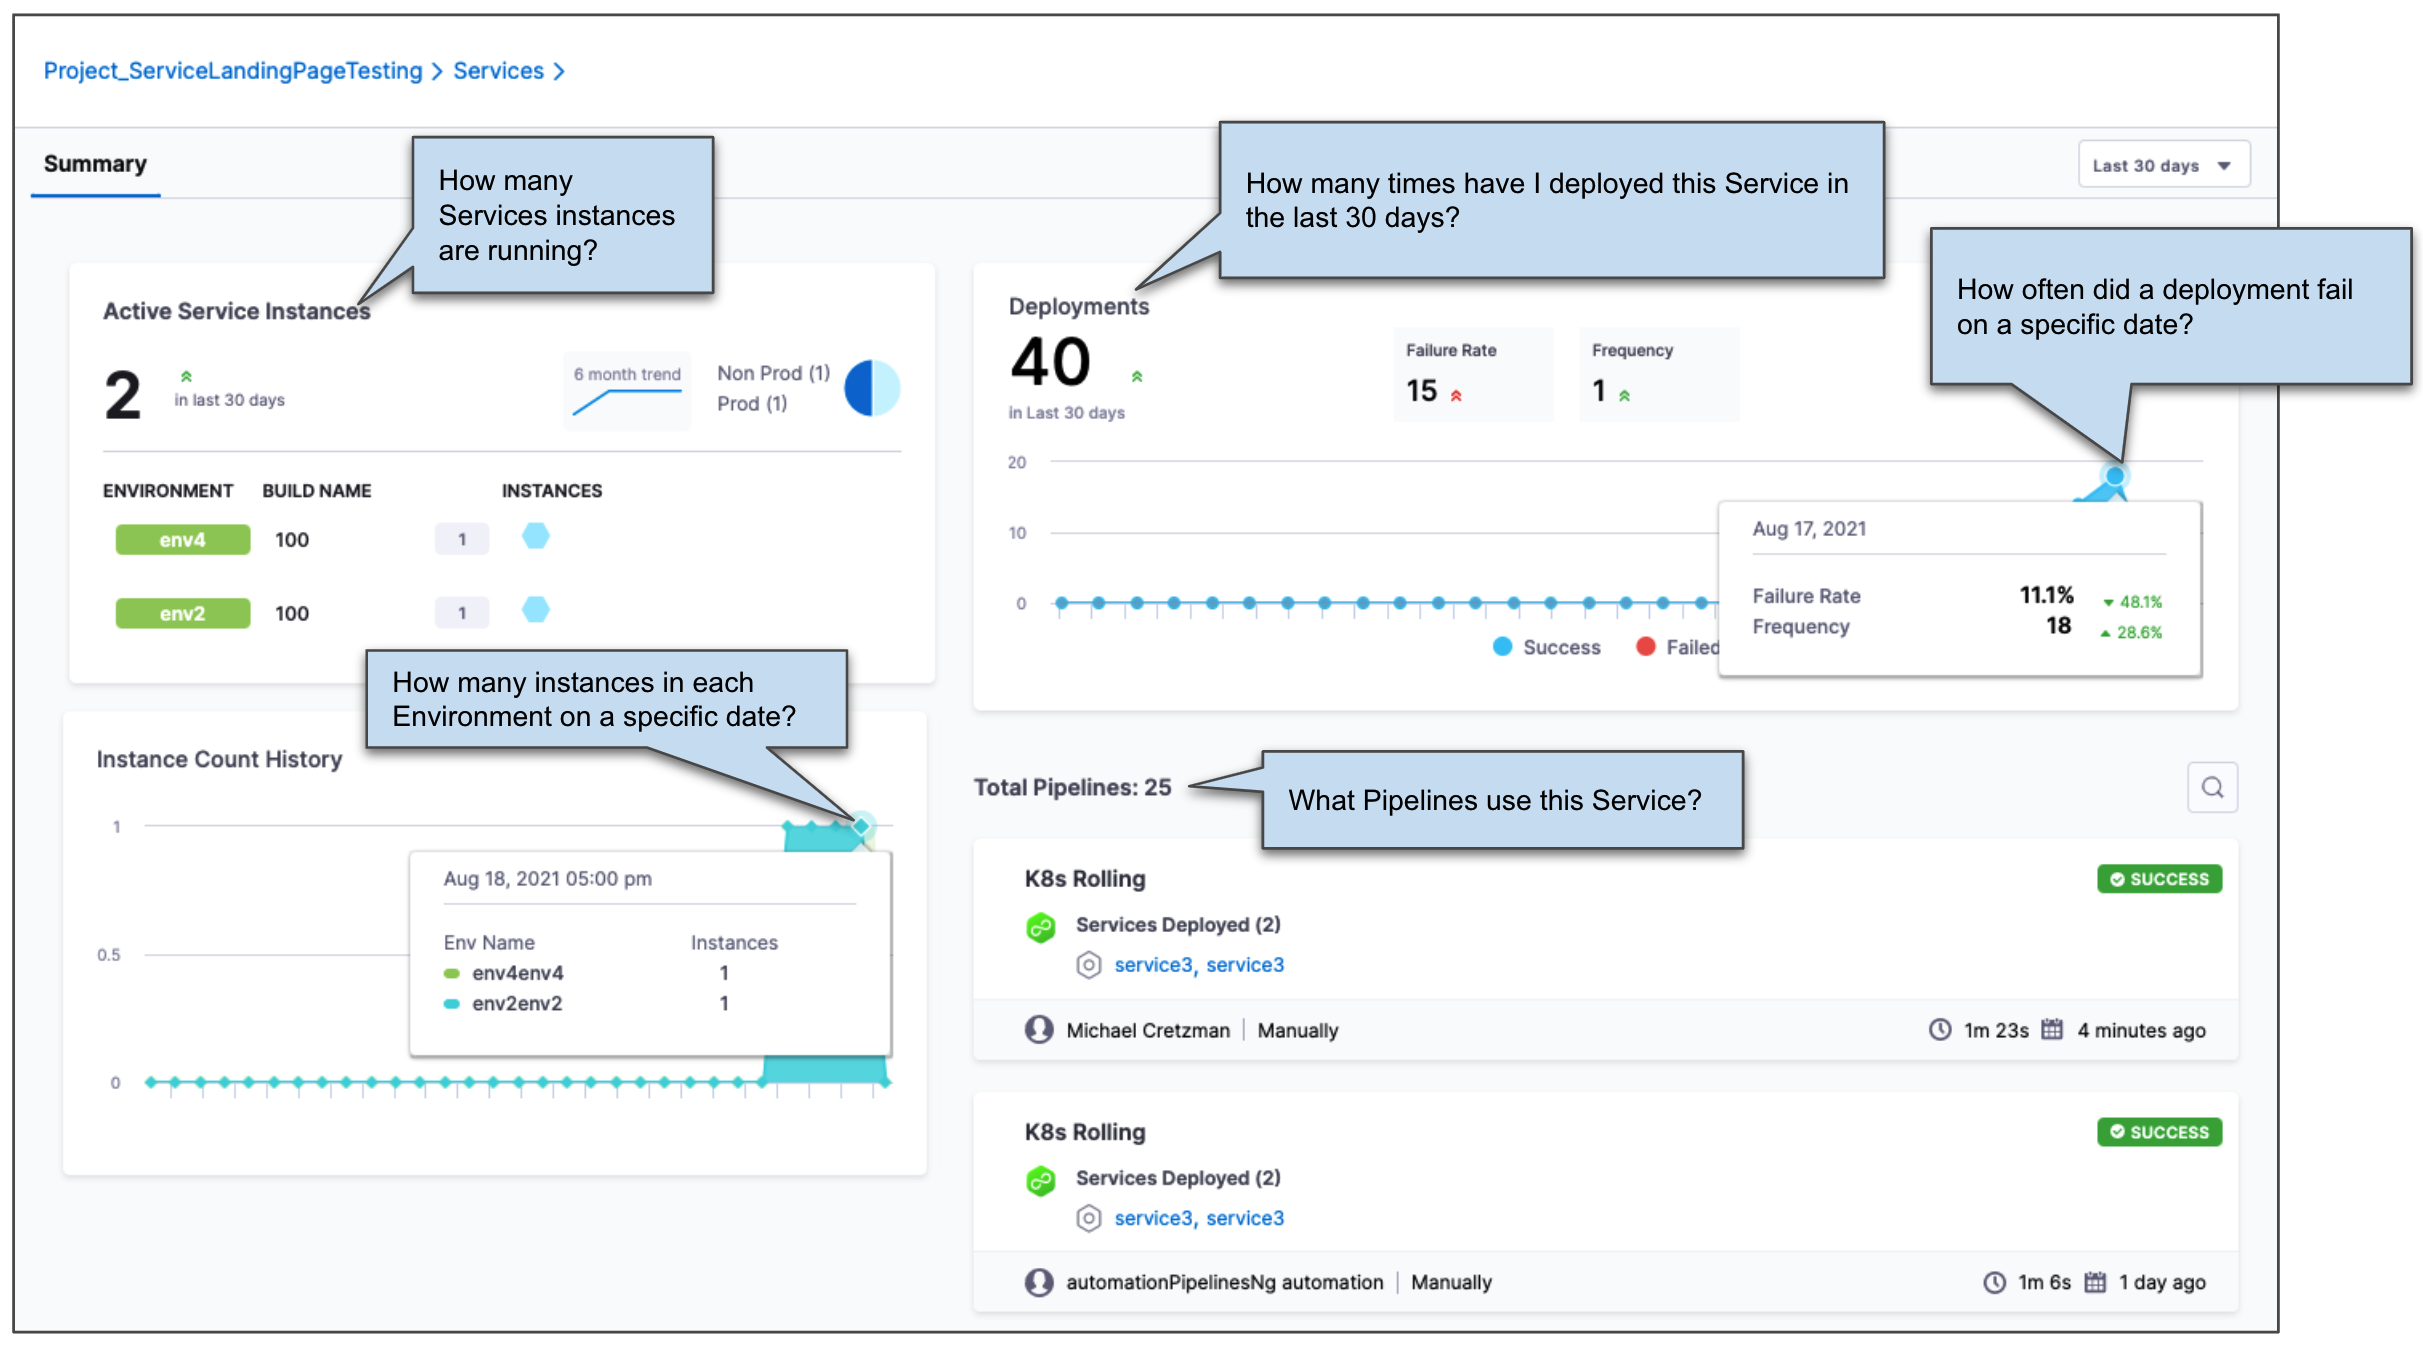
Click a Service in the Total Services table drills down to show more Service details:
Platform Dashboards
The account-wide Platform Dashboards in Harness contain built-in dashboards that provide advanced details about your deployments and services.
You can also create your own custom dashboards describing dimensions, aggregates, calculations, and data relationships.
The Platform Dashboards use LookML, a dependency-tracking tool that provides predefined data types and syntax for data modeling.
Built-in CD Dashboards
Currently, there are two built-in CD Dashboads: Deployments and Services.
To view these dashboards, in Harness, click Dashboards.
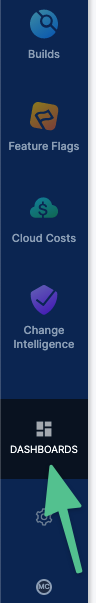
In Dashboards, click Deployments or By Harness.
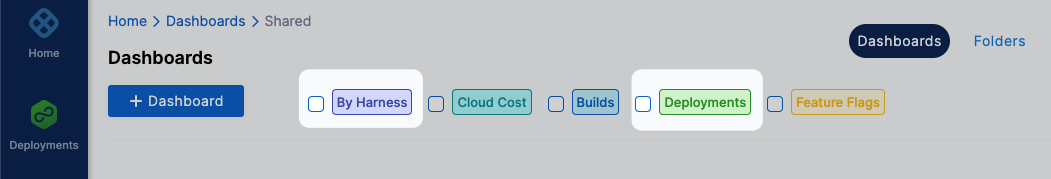
Look for Deployments Dashboard and Services Dashboard in the dashboards that appear.
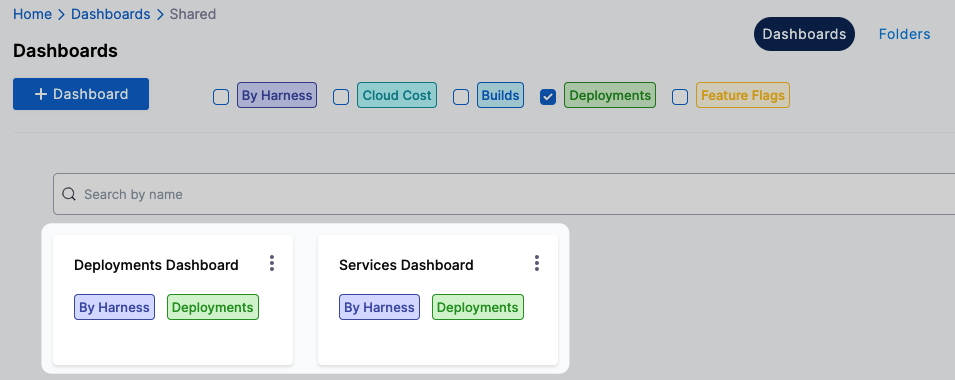
Let's look at each dashboard.
Deployments
The Deployments dashboard provides deployment frequency, status, and duration data in detail:
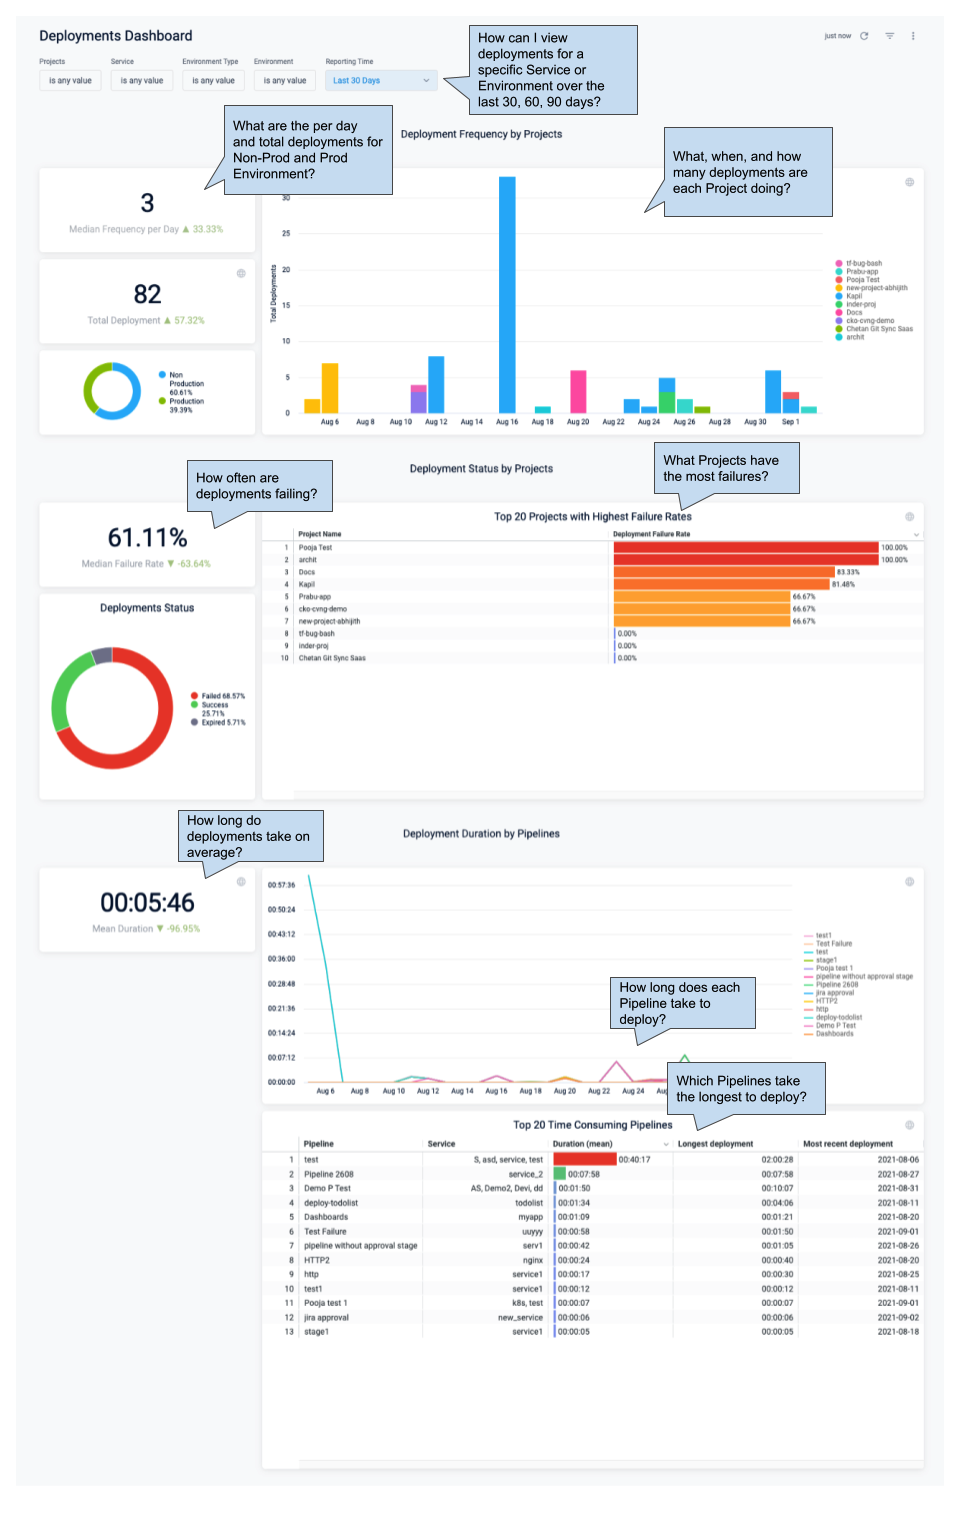
Clicking on data points or Service and Project names brings up data tables.
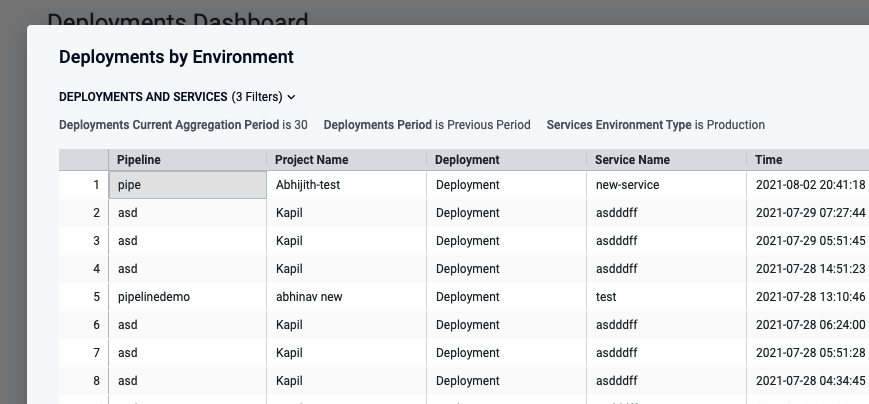
Click on the Pipeline or Deployment and a new browser tab opens with the Pipeline or deployment from the record.
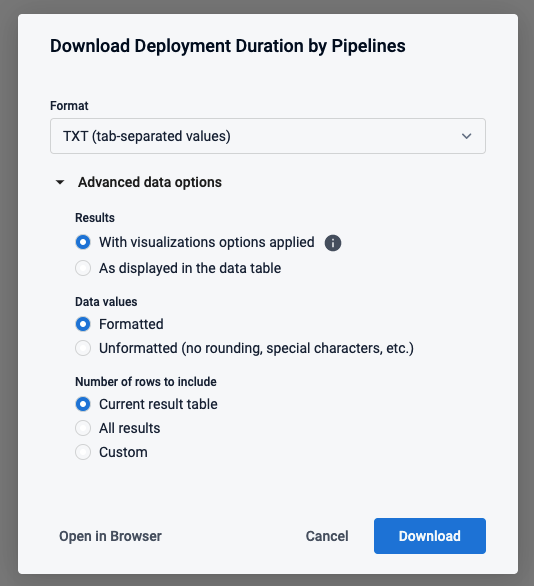
All data can be downloaded in multiple formats with multiple options.
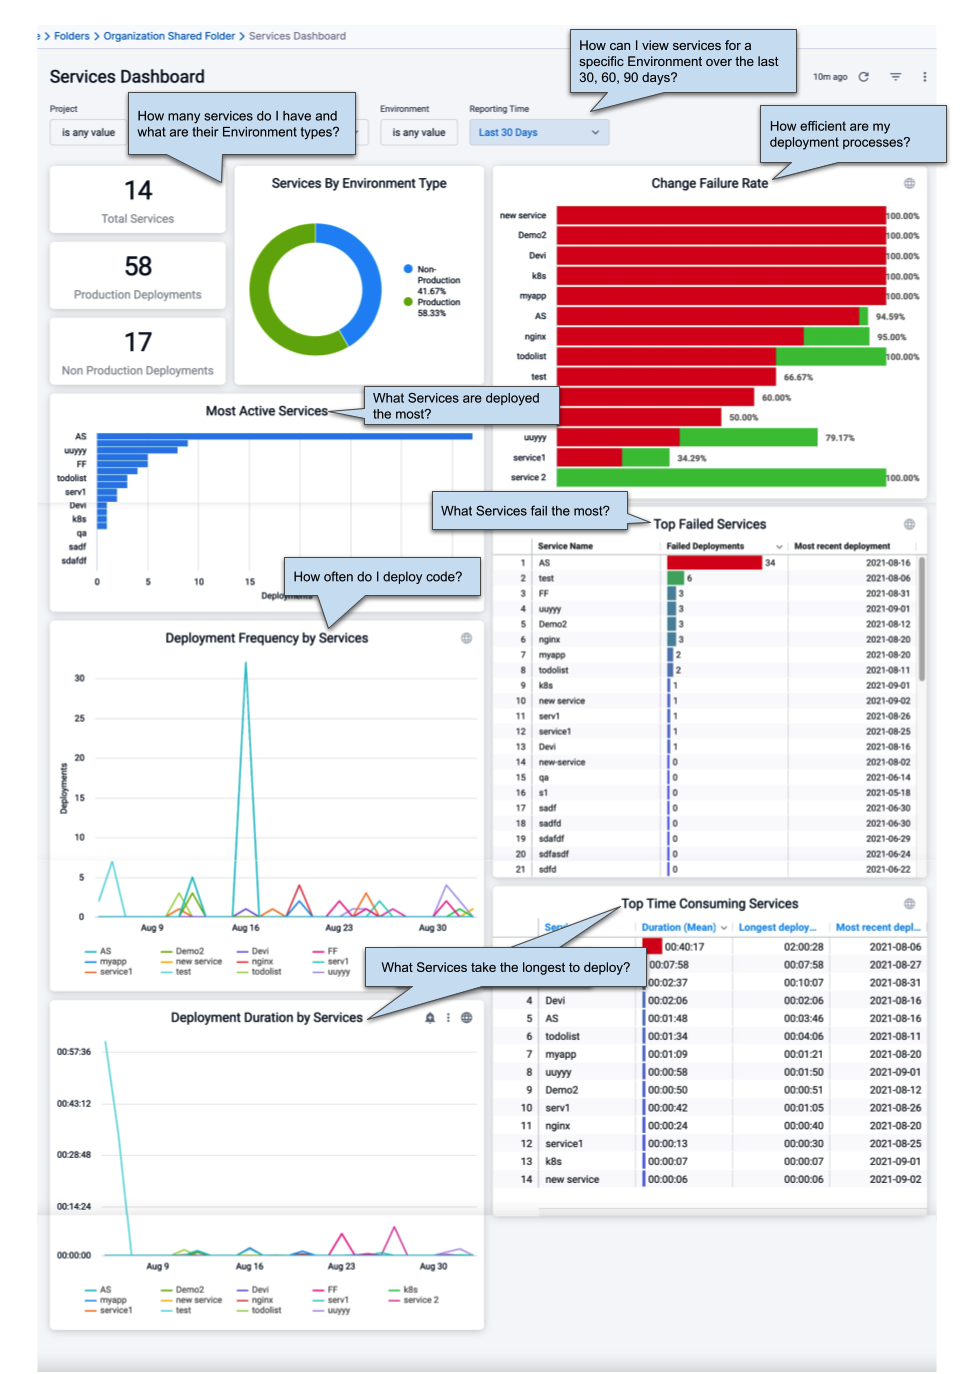
Services
The Services dashboard lets you measure the efficiency of your Service deployments by Environment and overall.
Custom CD Dashboards
You can create custom CD dashboards that visualize deployment data by different dimensions and measures.
Here's a quick video showing how to create a CD custom dashboard:
See Create Dashboards.