Connect to monitoring and logging systems
Connect Harness to monitoring and logging systems by adding a verification provider Connector.
You can add a verification provider Connector inline when developing your pipeline, or separately in your Account/Org/Project's resources. Once you add the Connector, it is available in Pipelines of the same Account/Org/Project.
Monitoring and Logging Systems Scope
You can add a verification provider Connector at the Account/Org/Project scope.
This topic will explain how to add it at the Project scope. The process is same for Org and Account.
Step: Add AppDynamics
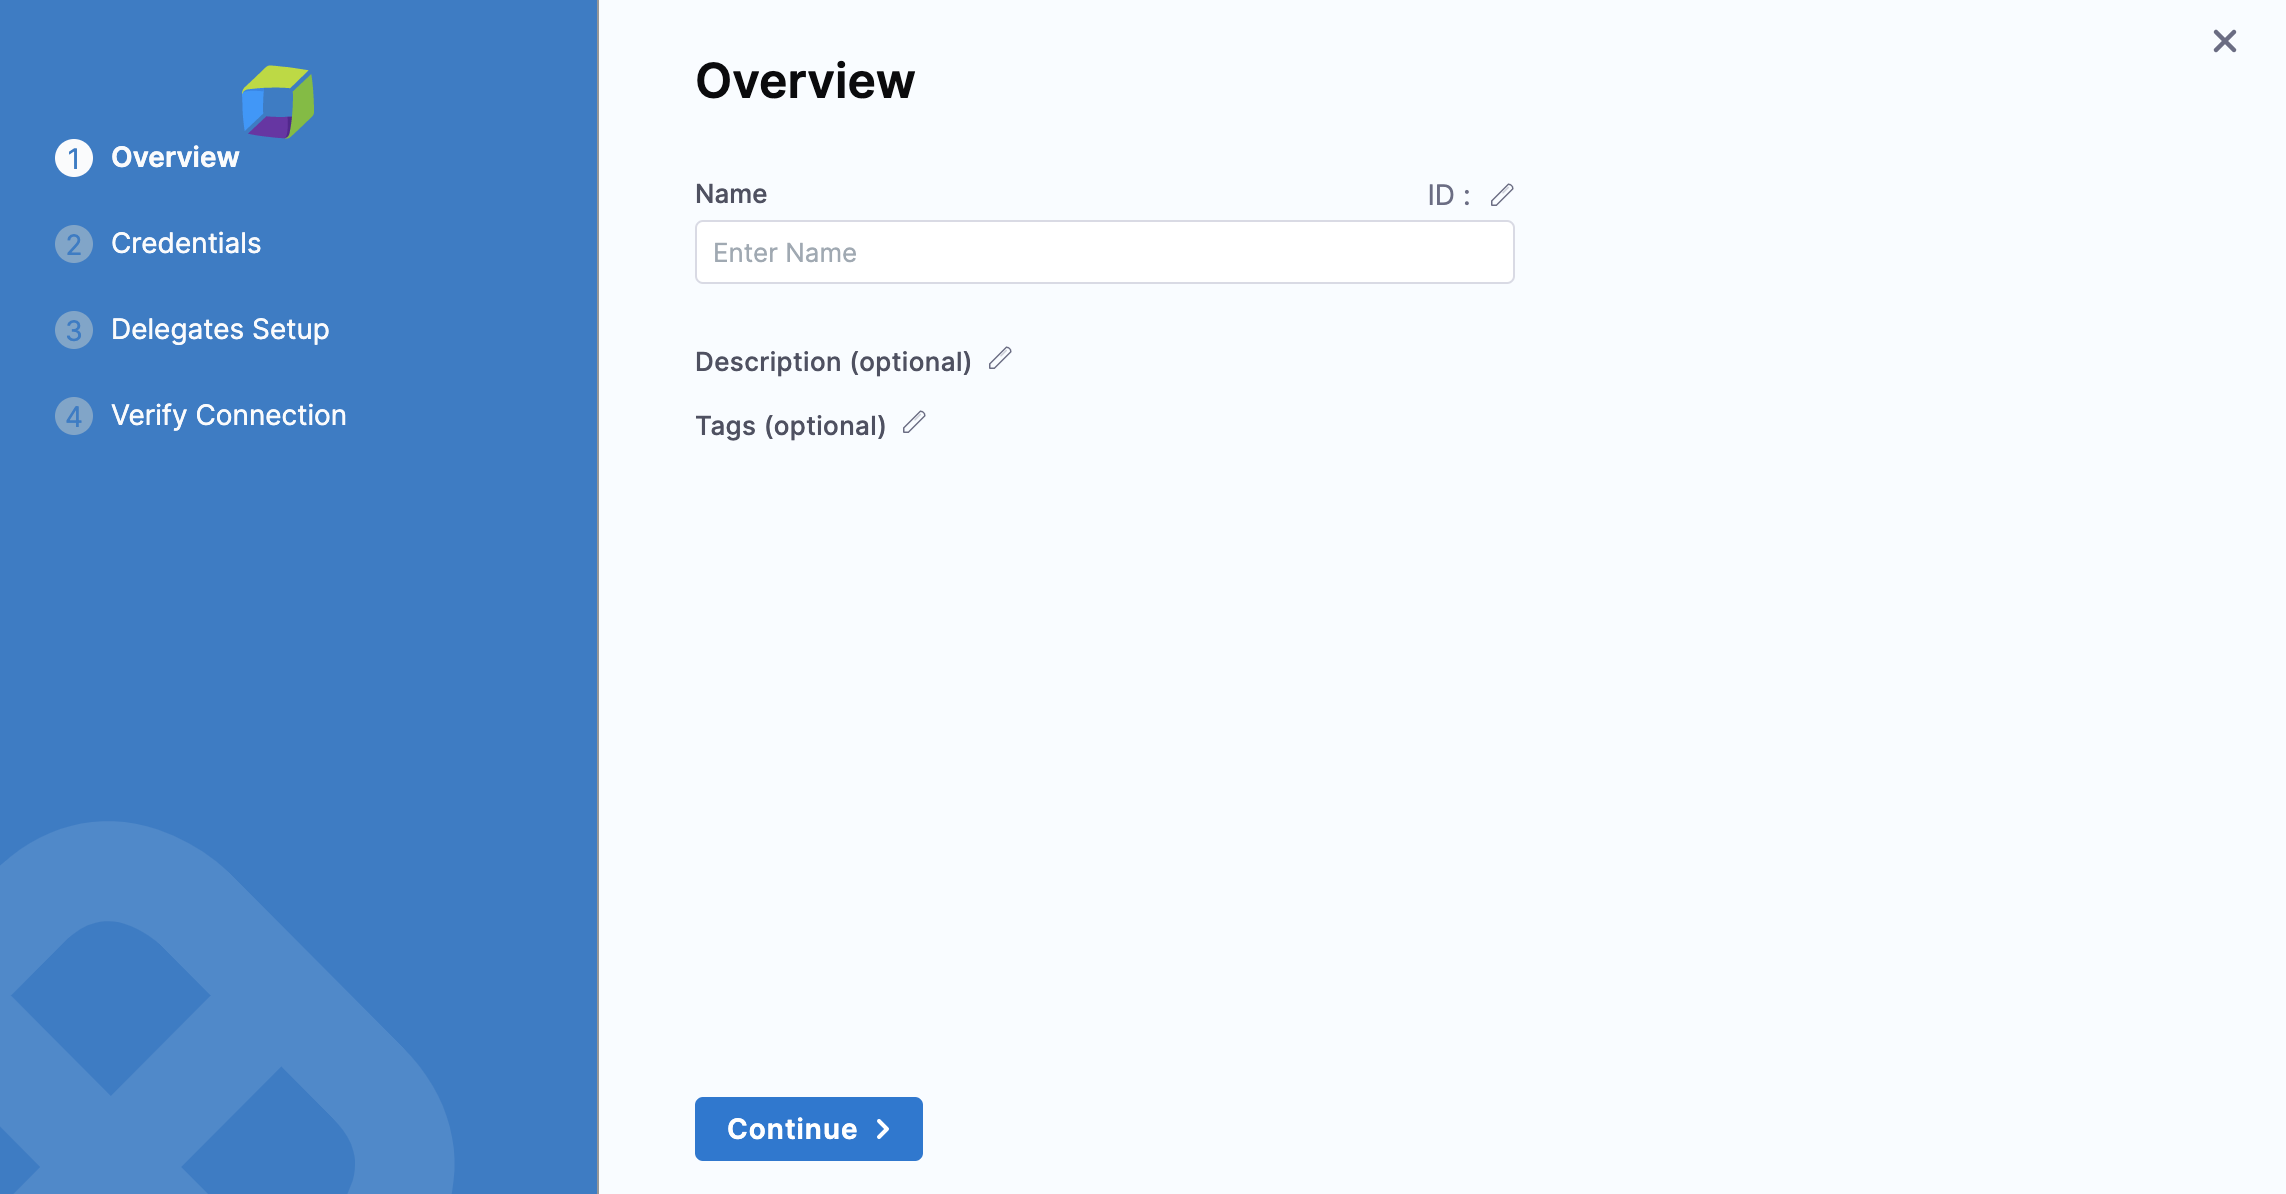
Open a Harness Project.
In Project Setup, click Connectors.
Click + Connector, and click AppDynamics in Monitoring and Logging Systems. The AppDynamics connector settings appear.
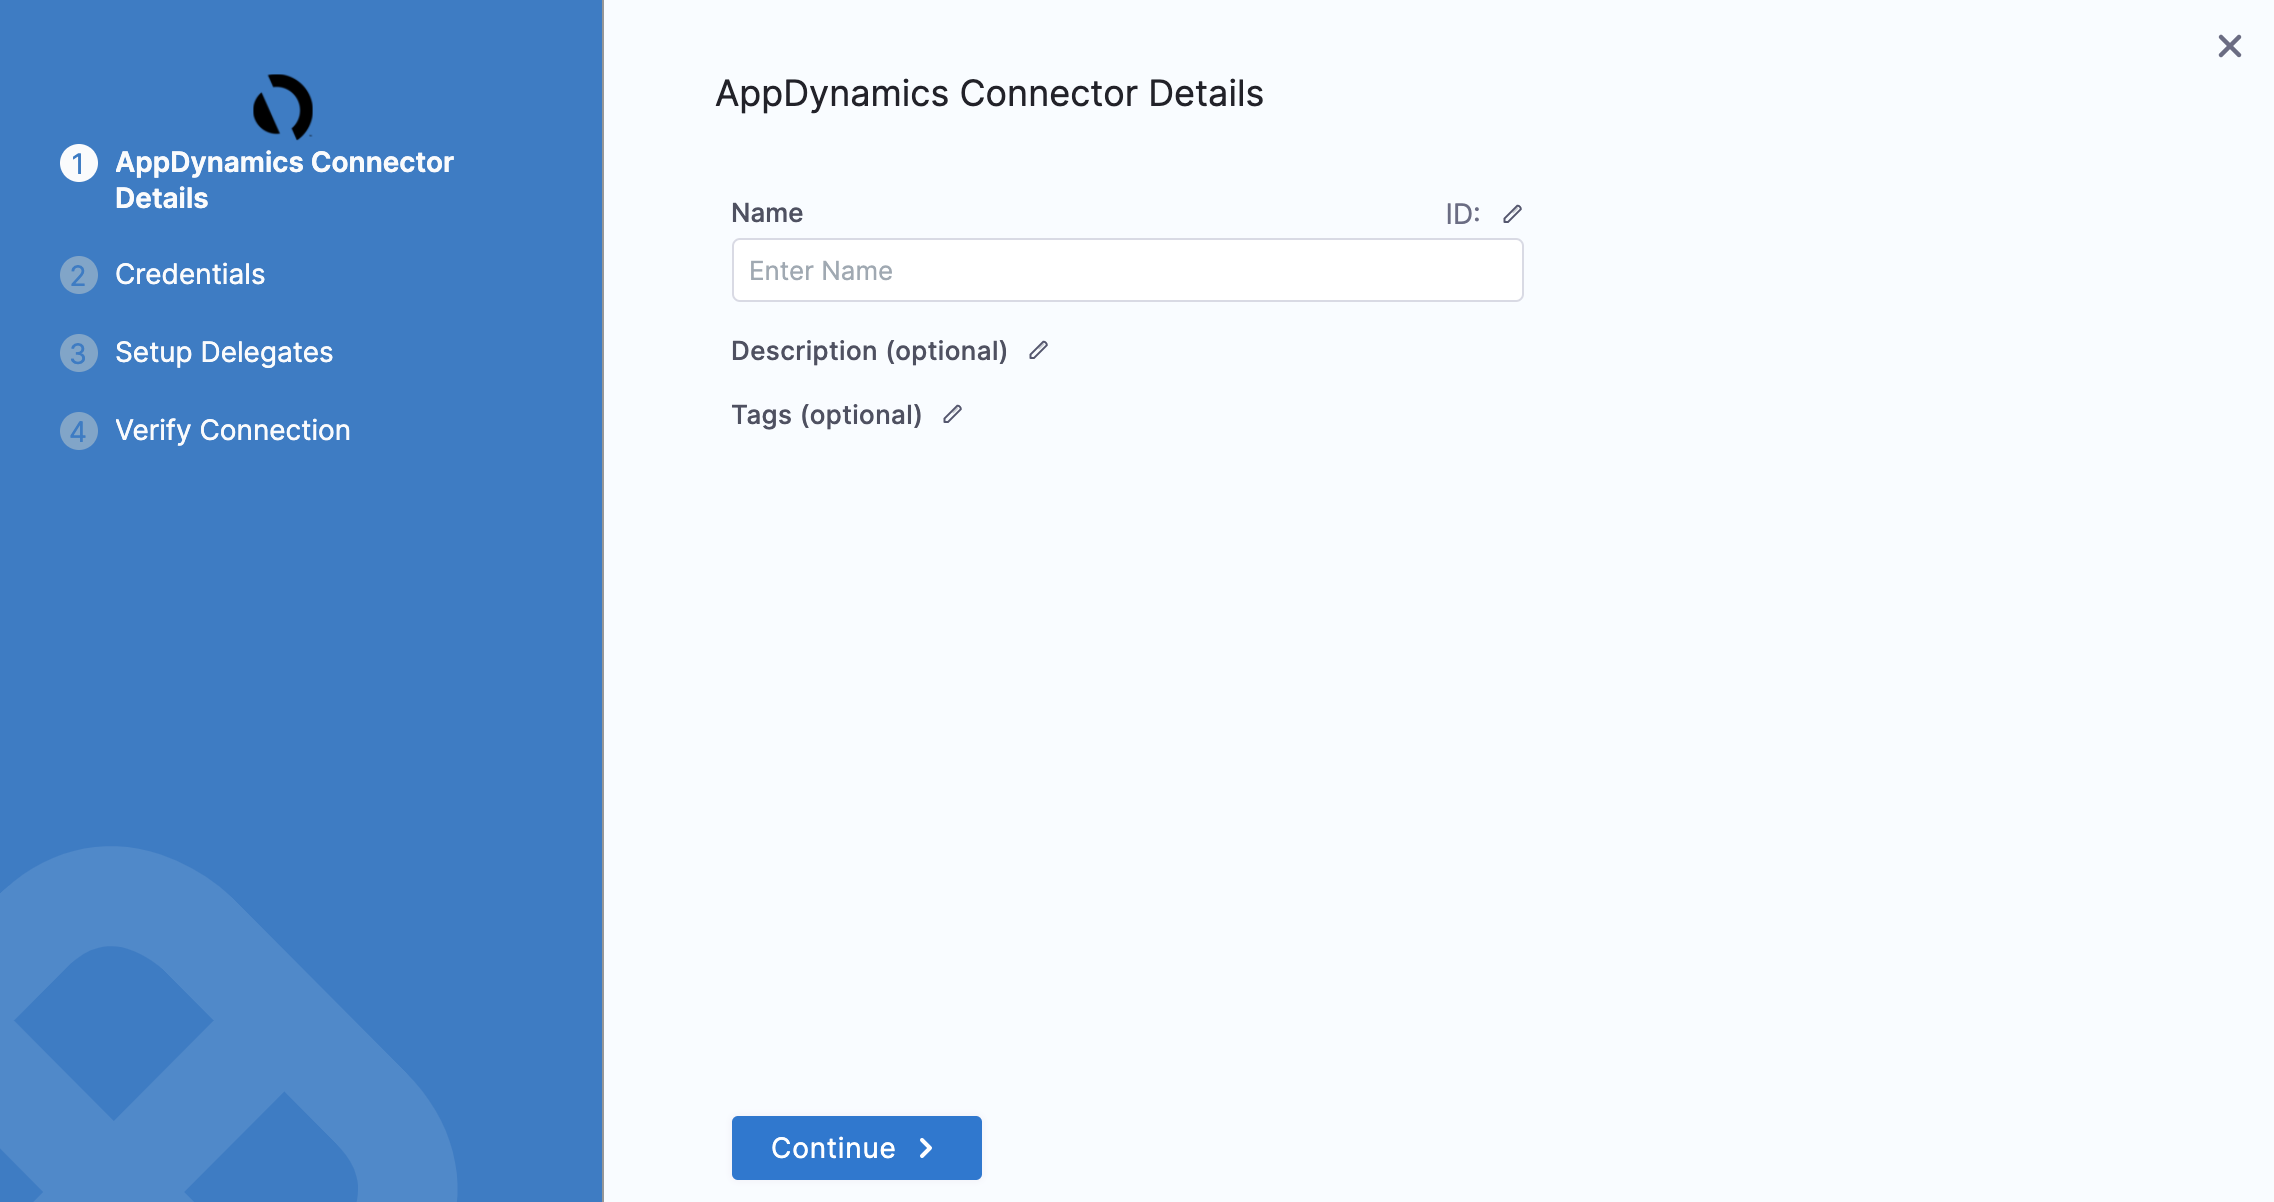
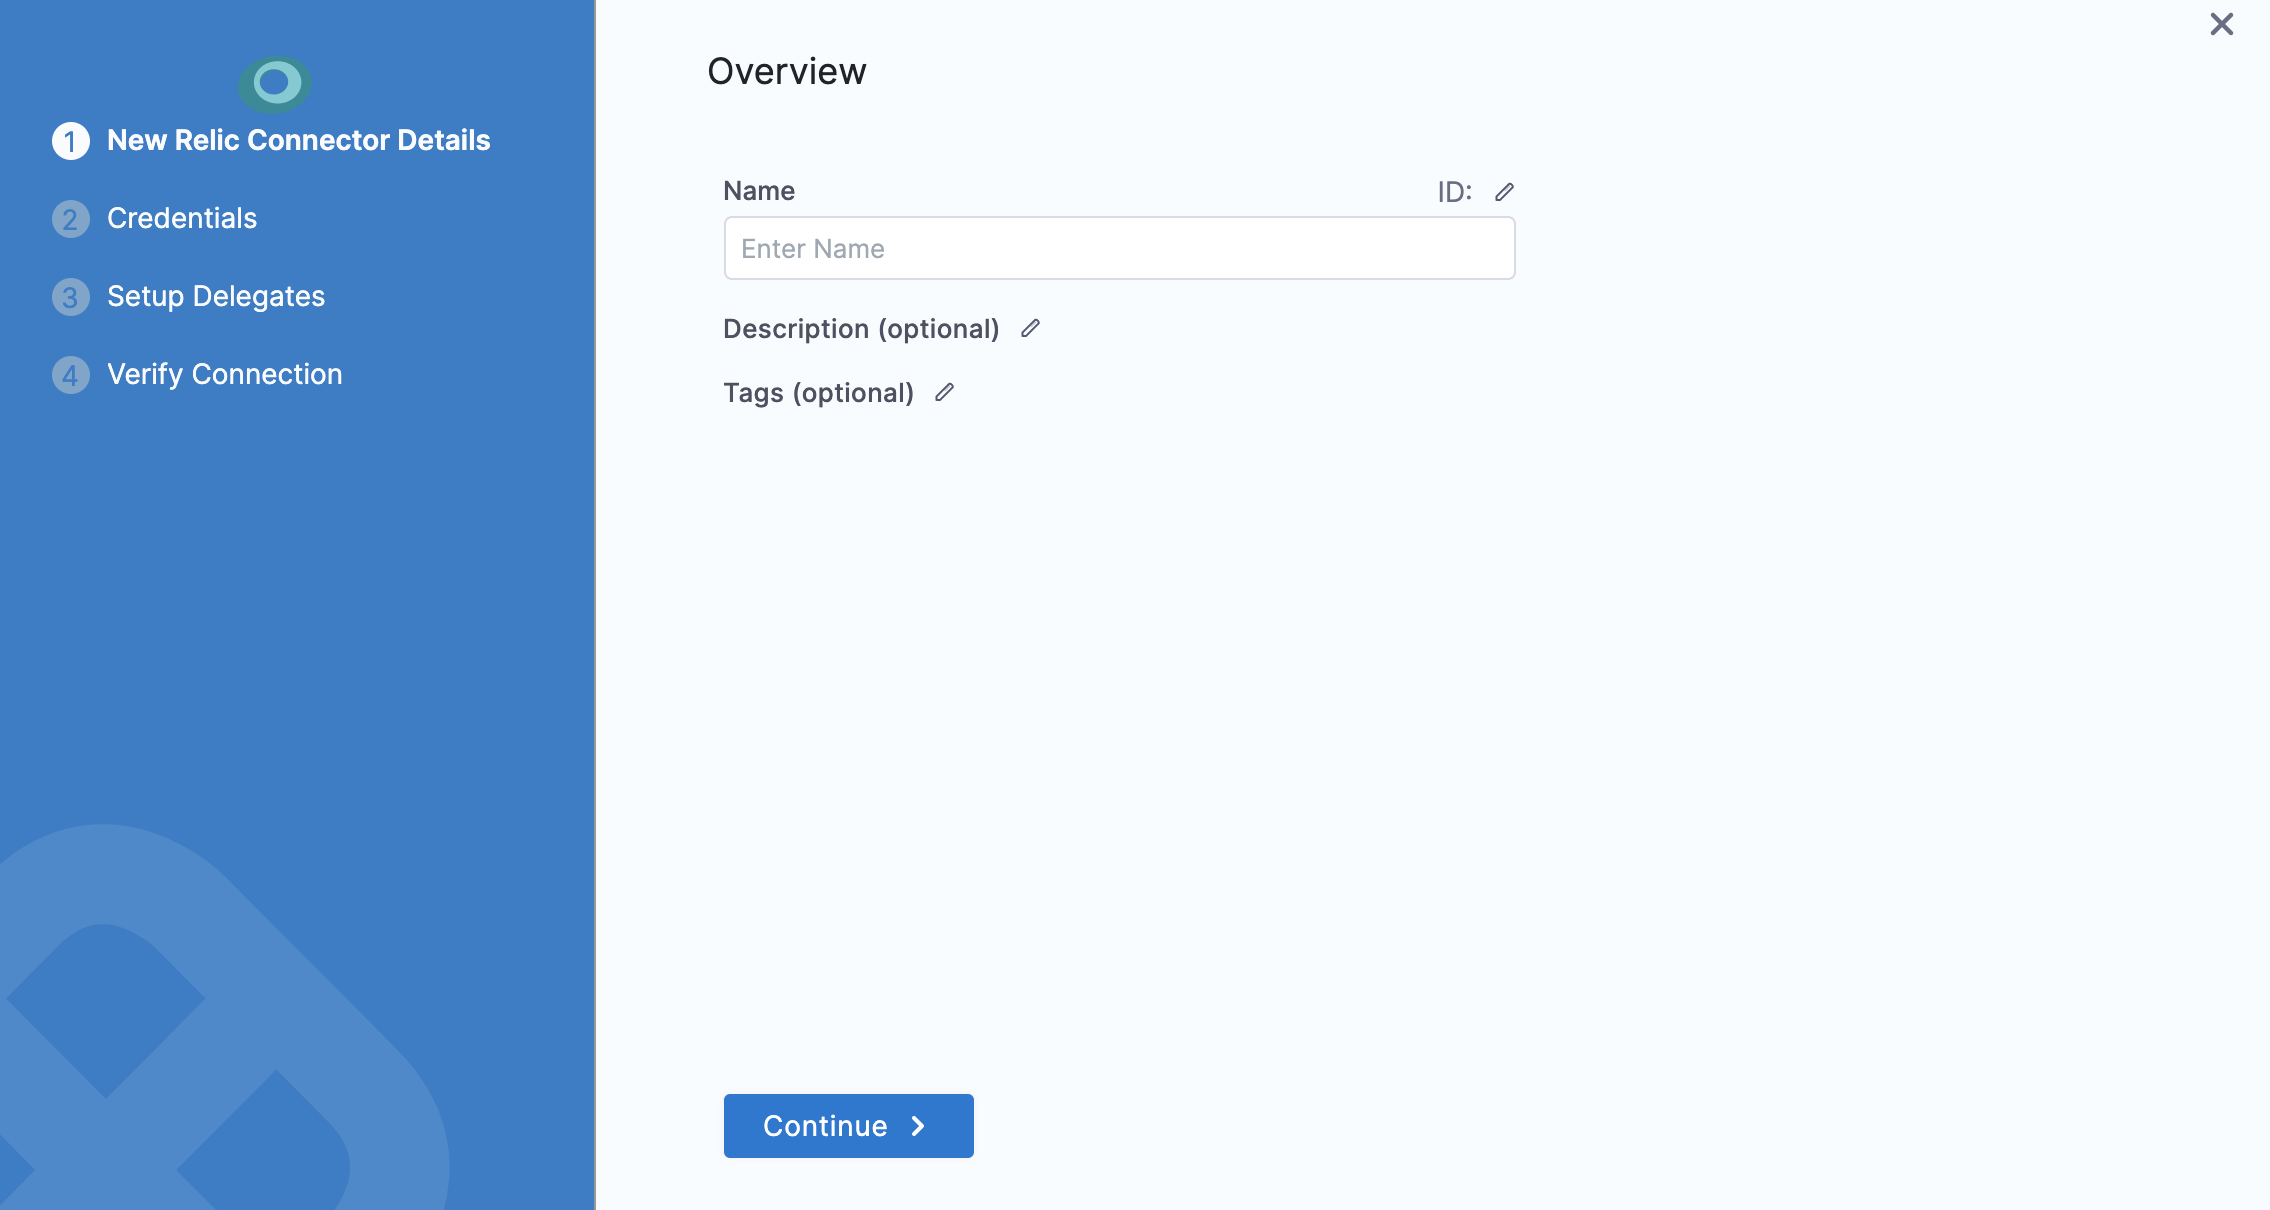
In Name, enter a name for this connector. You will use this name when selecting the Verification Provider in Harness Environments and Workflows. If you plan to use multiple providers of the same type, ensure that you give each provider a different name.
Click Continue.
In the Controller URL field, enter the URL of the AppDynamic controller in the format:
http://<Controller_Host>:/controller
For example:
https://xxxx.saas.appdynamics.com/controller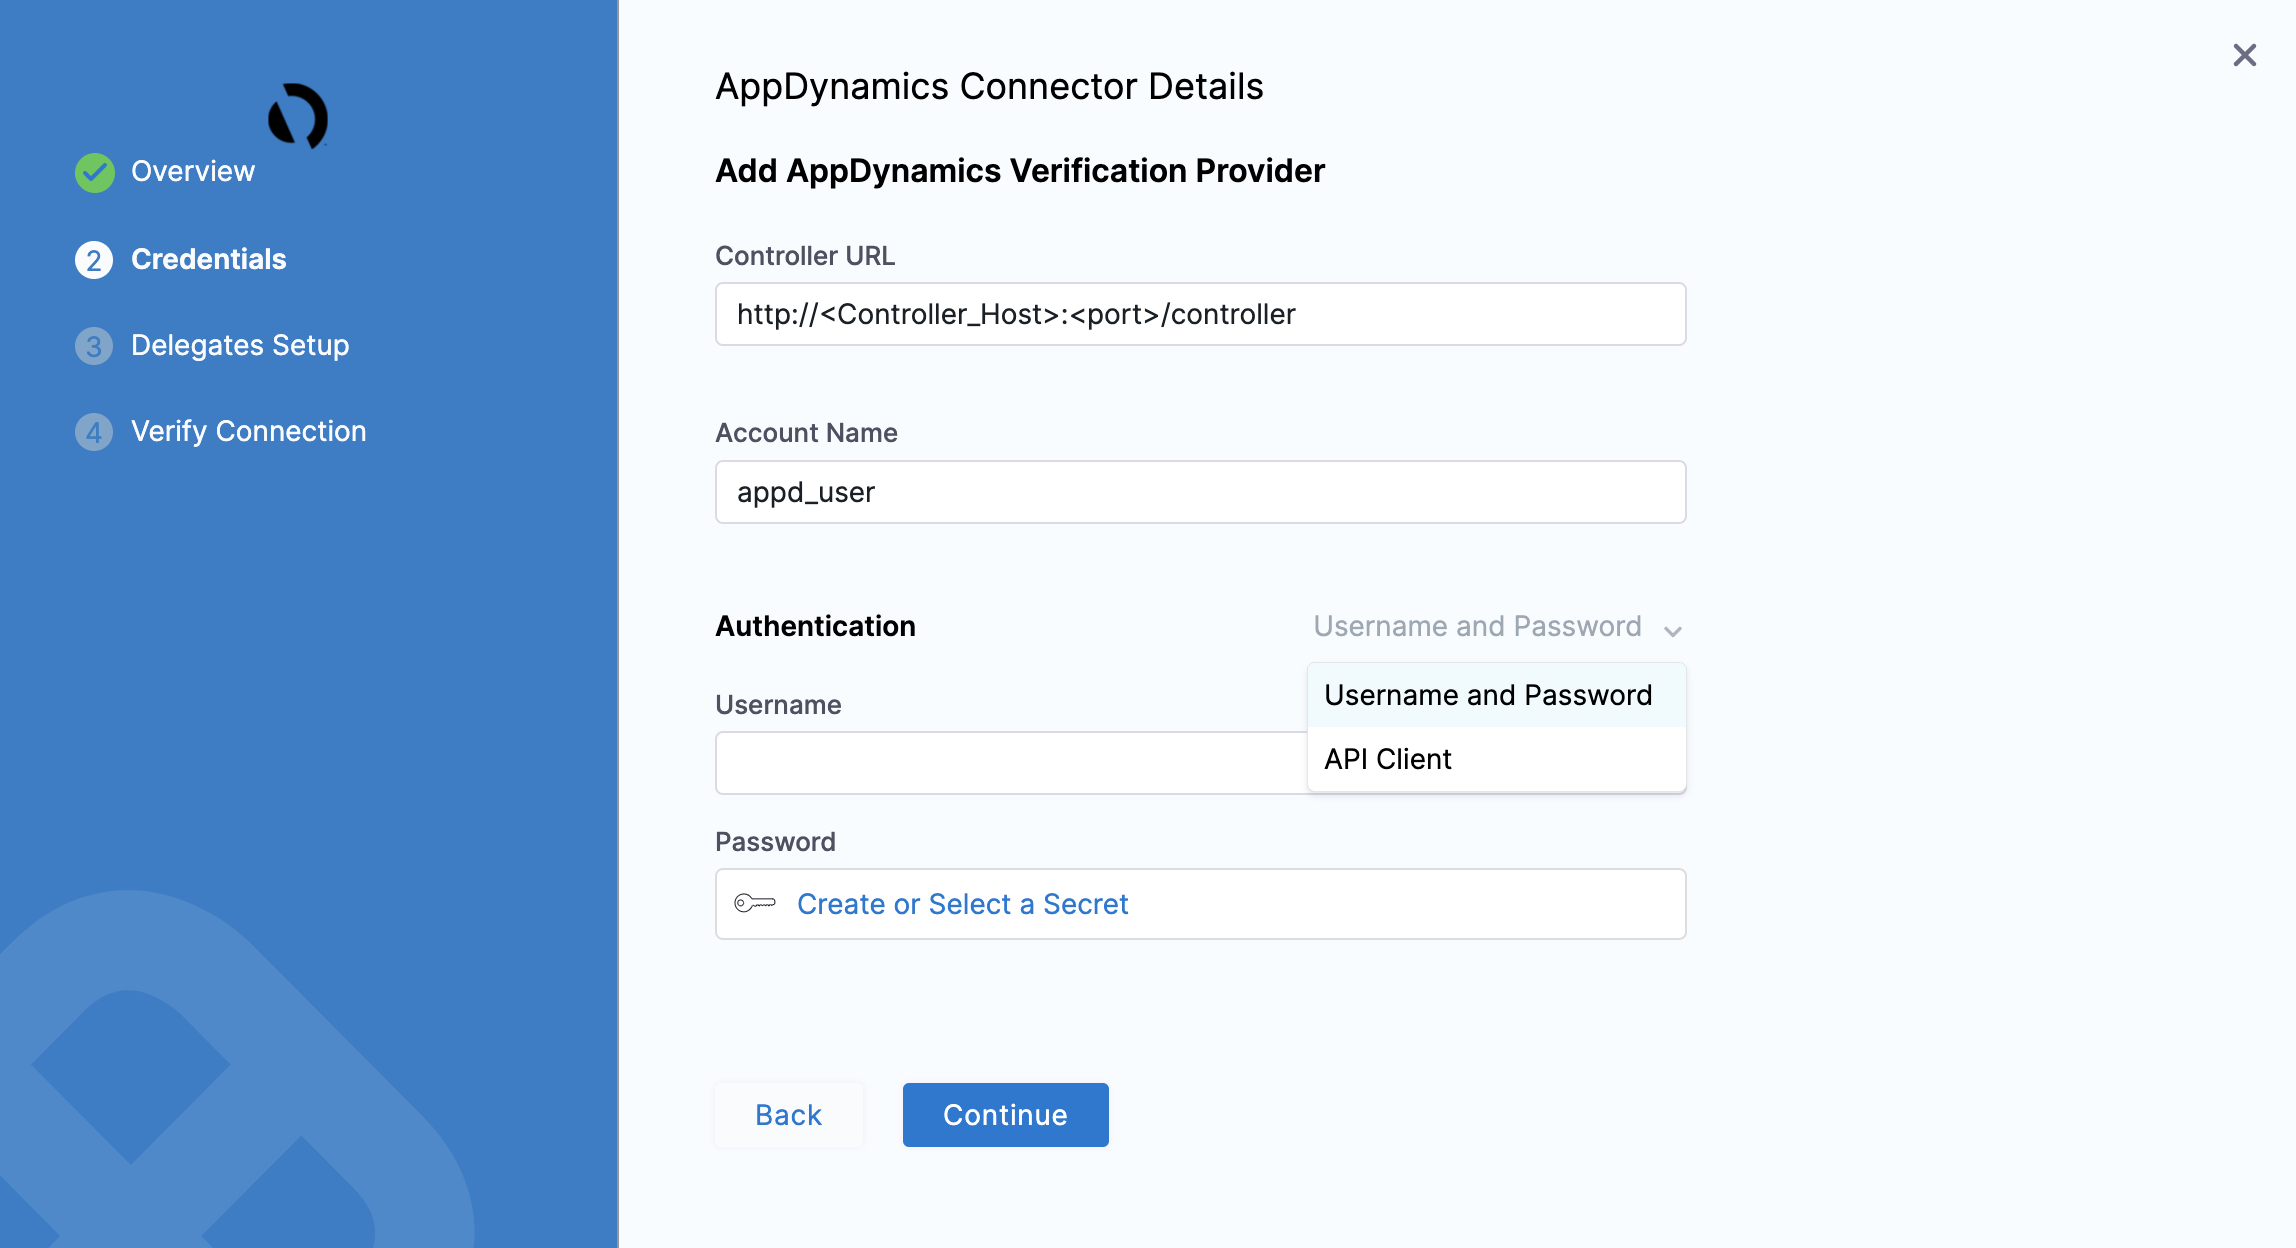
In Account Name, enter the name of AppDynamics account you want to use.
For Harness On-Prem, enter customer1.
- In Authentication, you can choose one of the following options:
- Username and Password: In User Name and Password, enter the credentials to authenticate with the AppDynamics server. In Password, you can choose Create or Select a secret.
- API Client: In Client Id and Client Secret fields, enter a valid Id and secret string that the application uses to prove its identity when requesting a token. In Client Secret, you can choose Create or Select a secret.
- Click Continue. The Setup Delegates settings appear.
- You can choose Connect via any available delegate or Connect only via delegates which has all of the following tags. If you select a Delegate, Harness will always use that Delegate for this Connector.
- Click Save and Continue.
- Once the Test Connection succeeds, click Finish. AppDynamics is listed under the list of Connectors.
Step: Add Prometheus
Open a Harness Project.
In Project Setup, click Connectors.
Click + Connector, and click Prometheusin Monitoring and Logging Systems. The Prometheus connector settings appear.
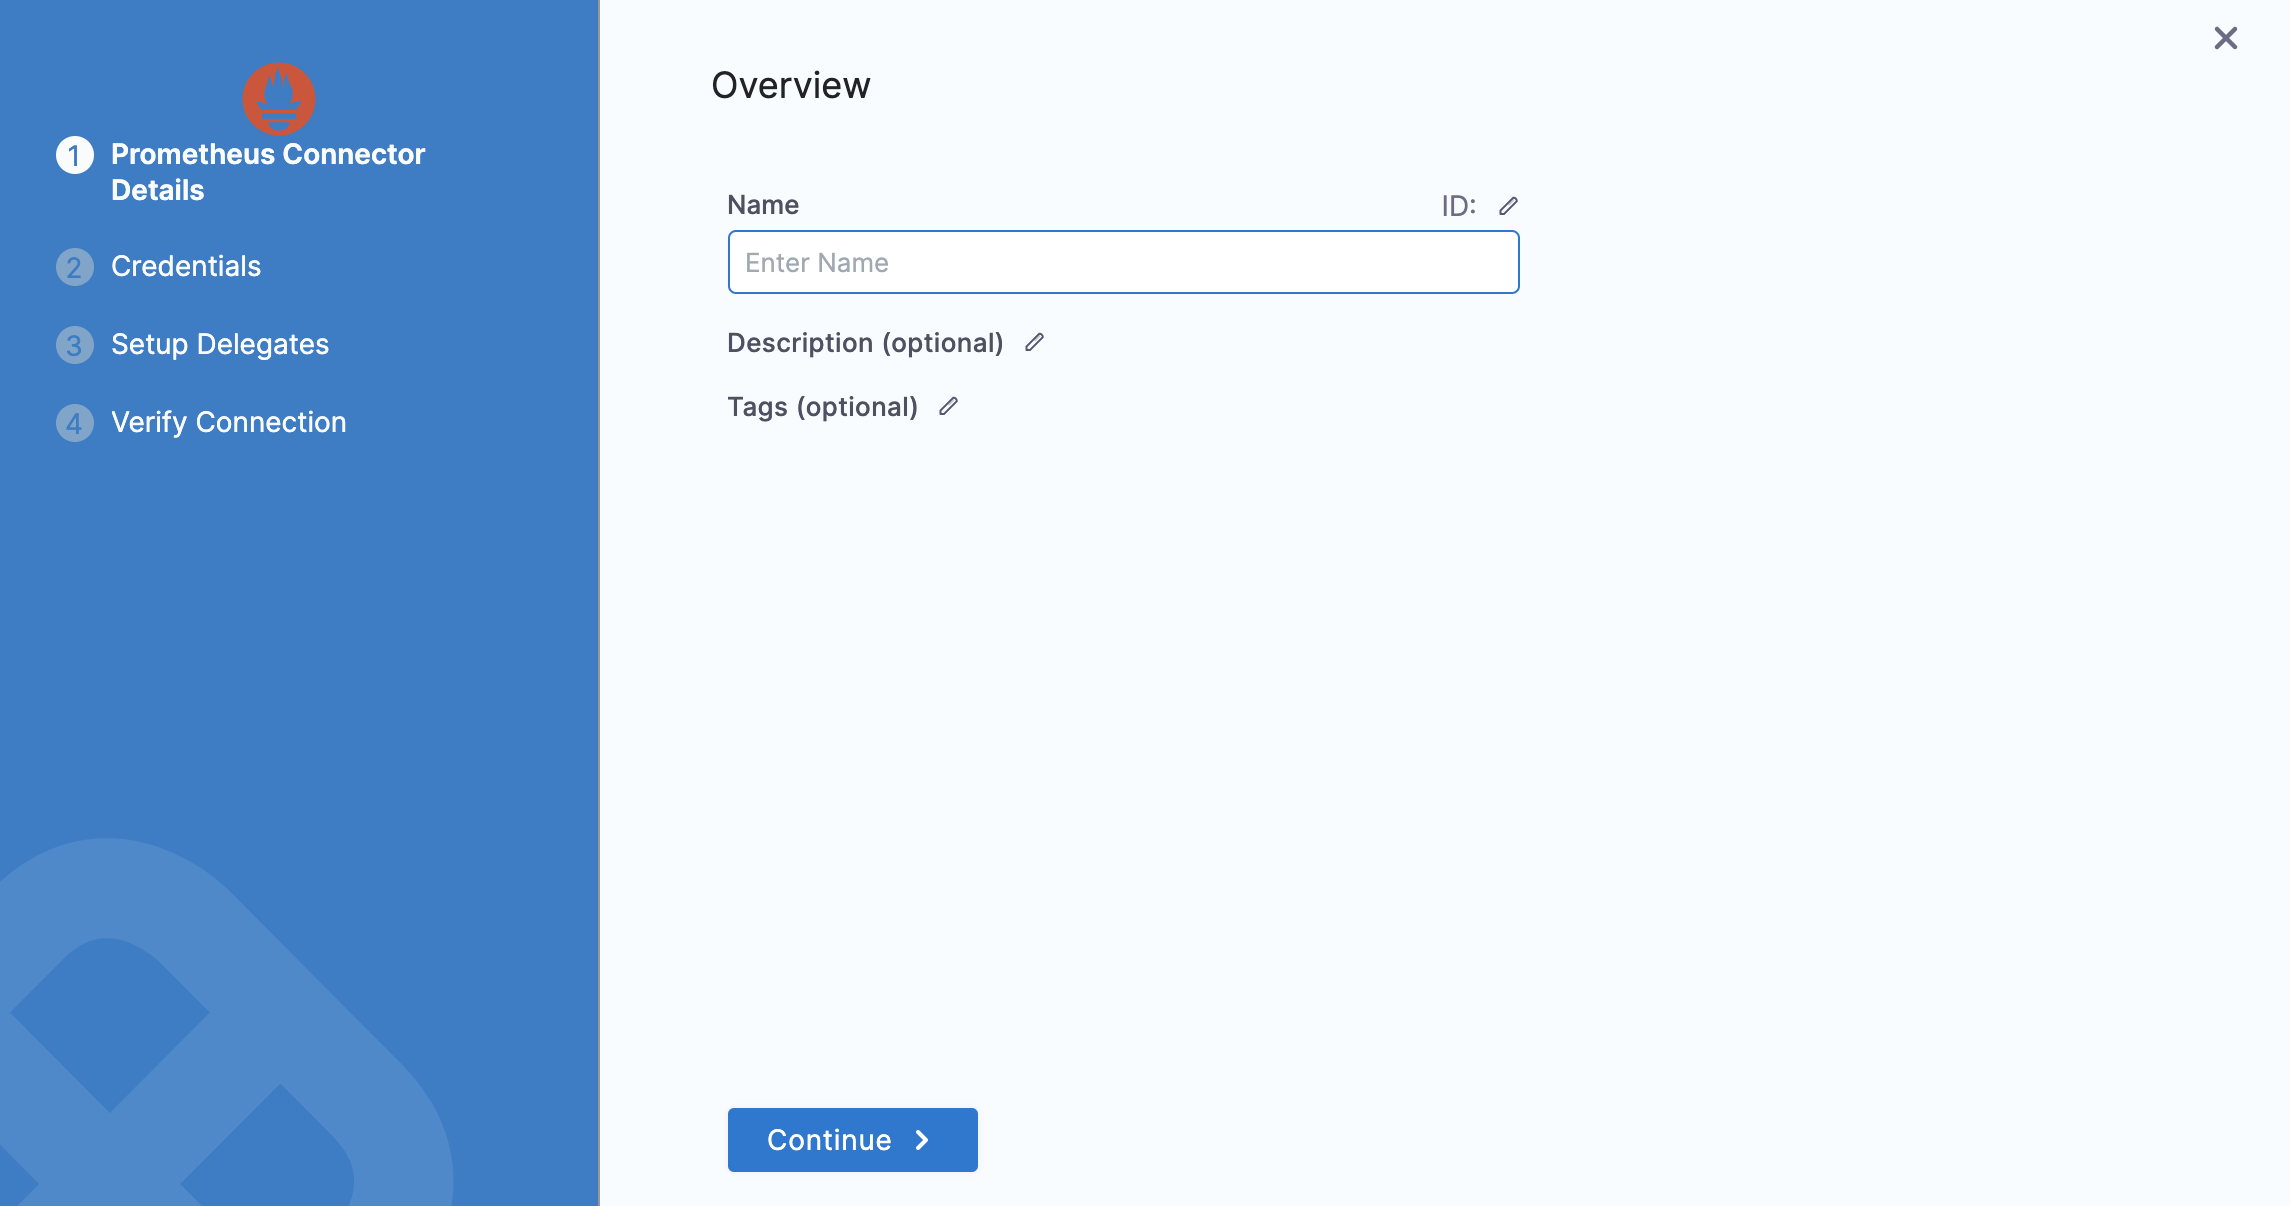
In Name, enter a name for this connector. If you are going to use multiple providers of the same type, ensure that you give each provider a different name.
Click Continue.
In the URL field, enter the URL of your Prometheus account. You cannot use a Grafana URL.
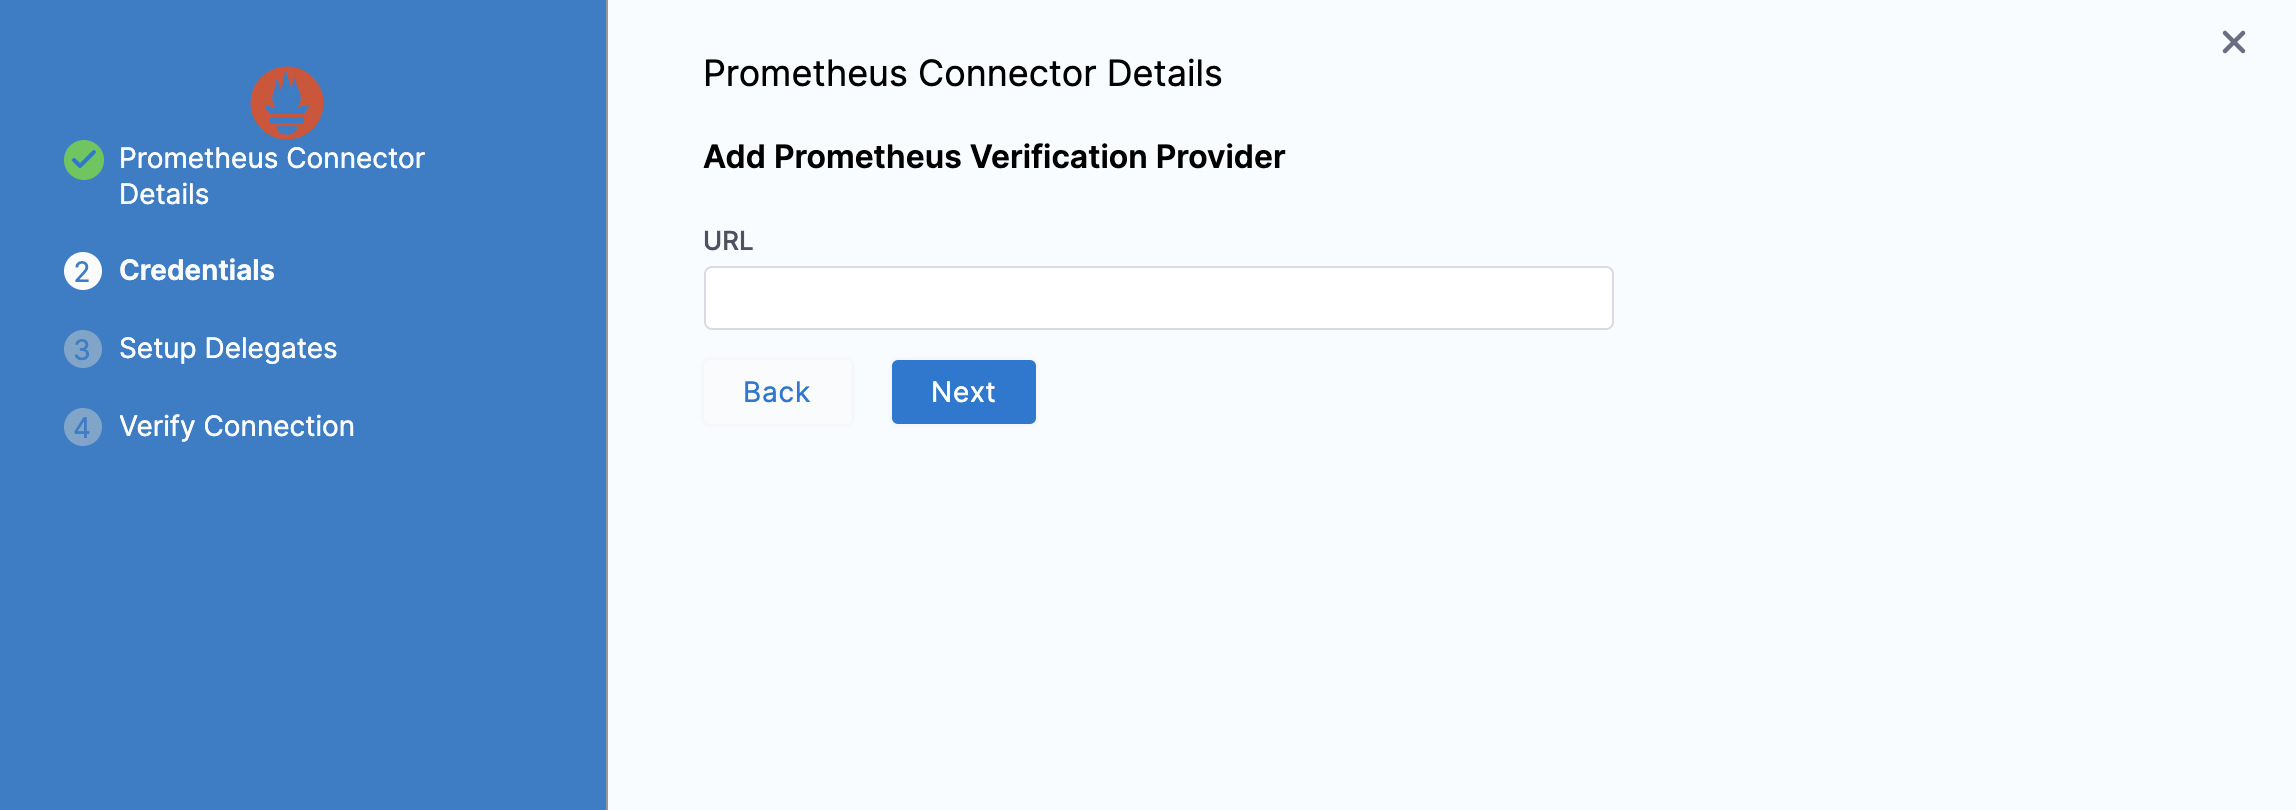
You cannot use a Grafana URL.
- Click Next. The Setup Delegates settings appear.
- You can choose Connect via any available delegate or Connect only via delegates which has all of the following tags. If you select a Delegate, Harness will always use that Delegate for this Connector.
- Click Save and Continue.
- Once the Test Connection succeeds, click Finish. Prometheus is listed under the list of Connectors.
Step: Add New Relic
Open a Harness Project.
In Project Setup, click Connectors.
Click + Connector, and click New Relicin Monitoring and Logging Systems. The New Relic connector settings appear.
In Name, enter a name for this connector. If you are going to use multiple providers of the same type, ensure you give each provider a different name.
Click Continue.
In the New Relic URL field, enter the URL of your New Relic account.
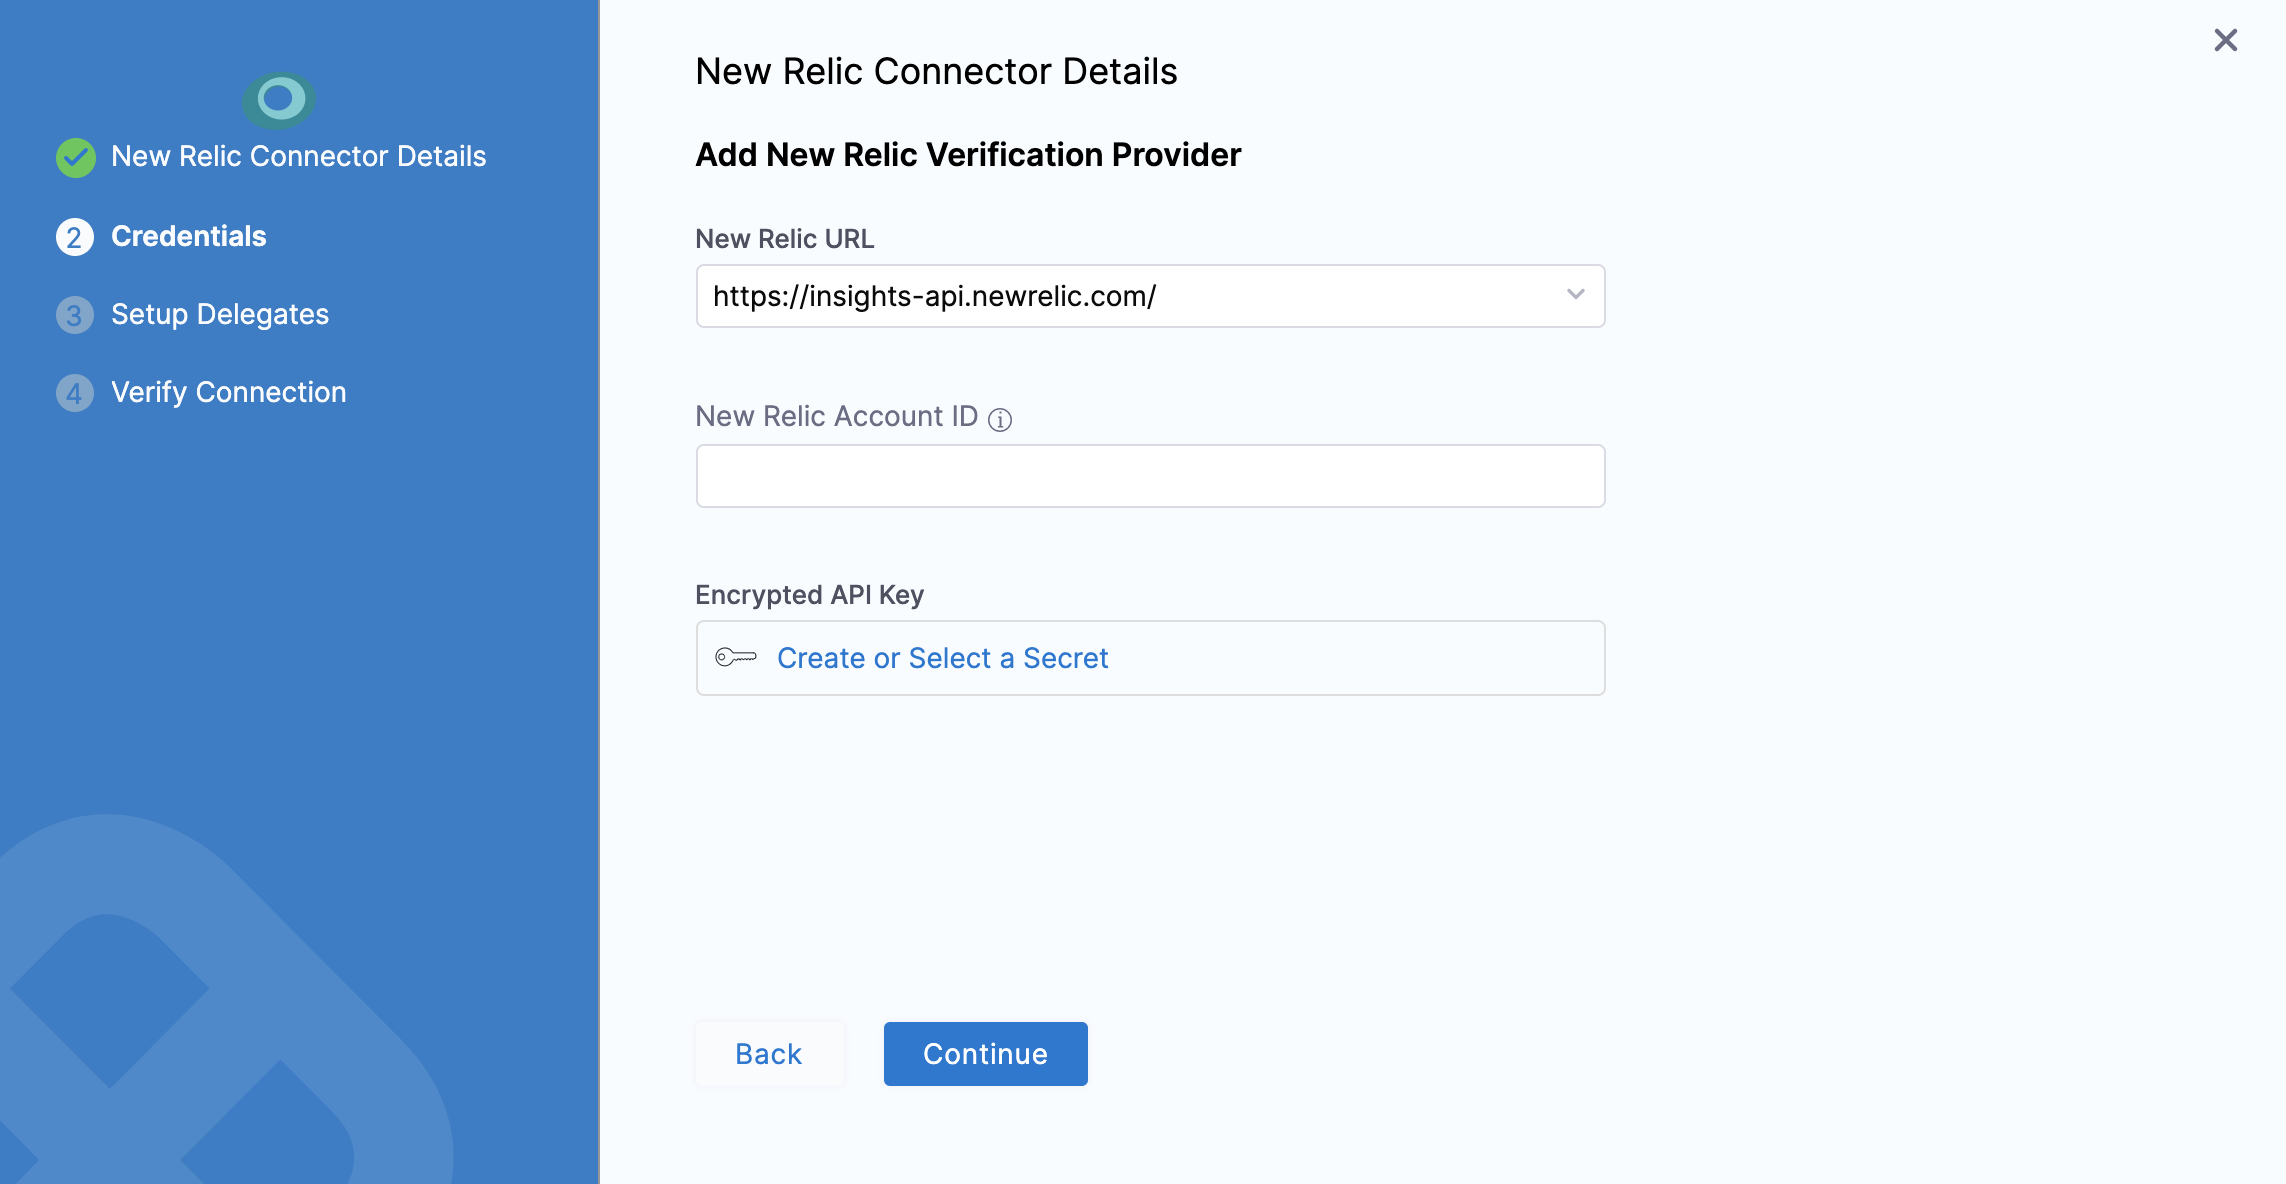
To get the New Relic Account ID for your New Relic account, copy the number after the /accounts/ portion of the URL in the New Relic Dashboard.
In Encrypted API Key, you can choose Create or Select a secret.
For secrets and other sensitive settings, select or create a new Text Secret.Enter the API key needed to connect with the server.
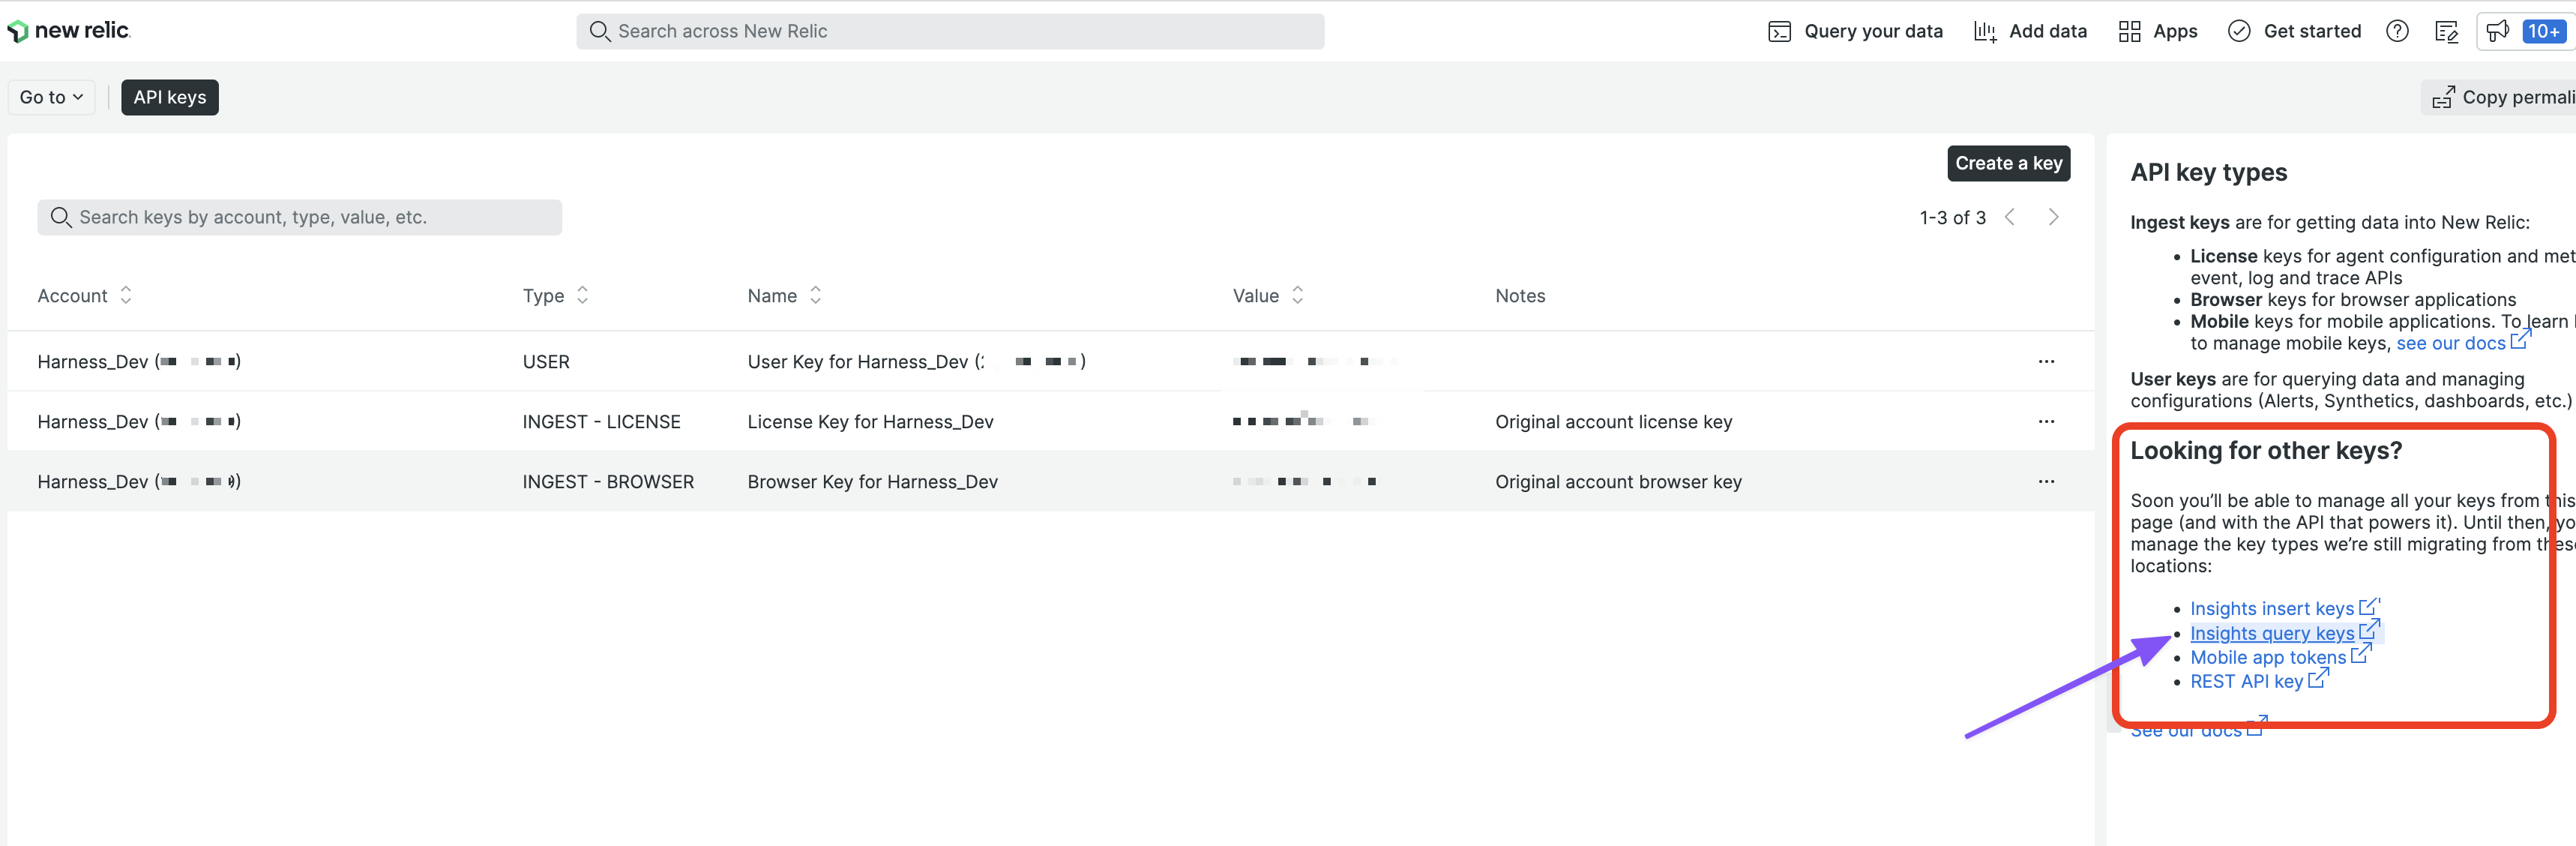
For steps on generating the New Relic API key, follow this doc from New Relic: Insights query API.
If you have trouble finding step on generating the Insights query key, look for the API key types help in the New Relic help panel:
- Click Continue. The Setup Delegates settings appear.
- You can choose Connect via any available delegate or Connect only via delegates which has all of the following tags. If you select a Delegate, Harness will always use that Delegate for this Connector.
- Click Save and Continue.
- Once the Test Connection succeeds, click Finish. New Relic is listed under the list of Connectors.
Usage scope is inherited from the secrets used in the settings. Pro or higher subscription level is needed. For more information, see Introduction to New Relic's REST API Explorer from New Relic.
Step: Add Splunk
Open a Harness Project.
In Project Setup, click Connectors.
Click + Connector, and click Splunkin Monitoring and Logging Systems. The Splunk connector settings appear.
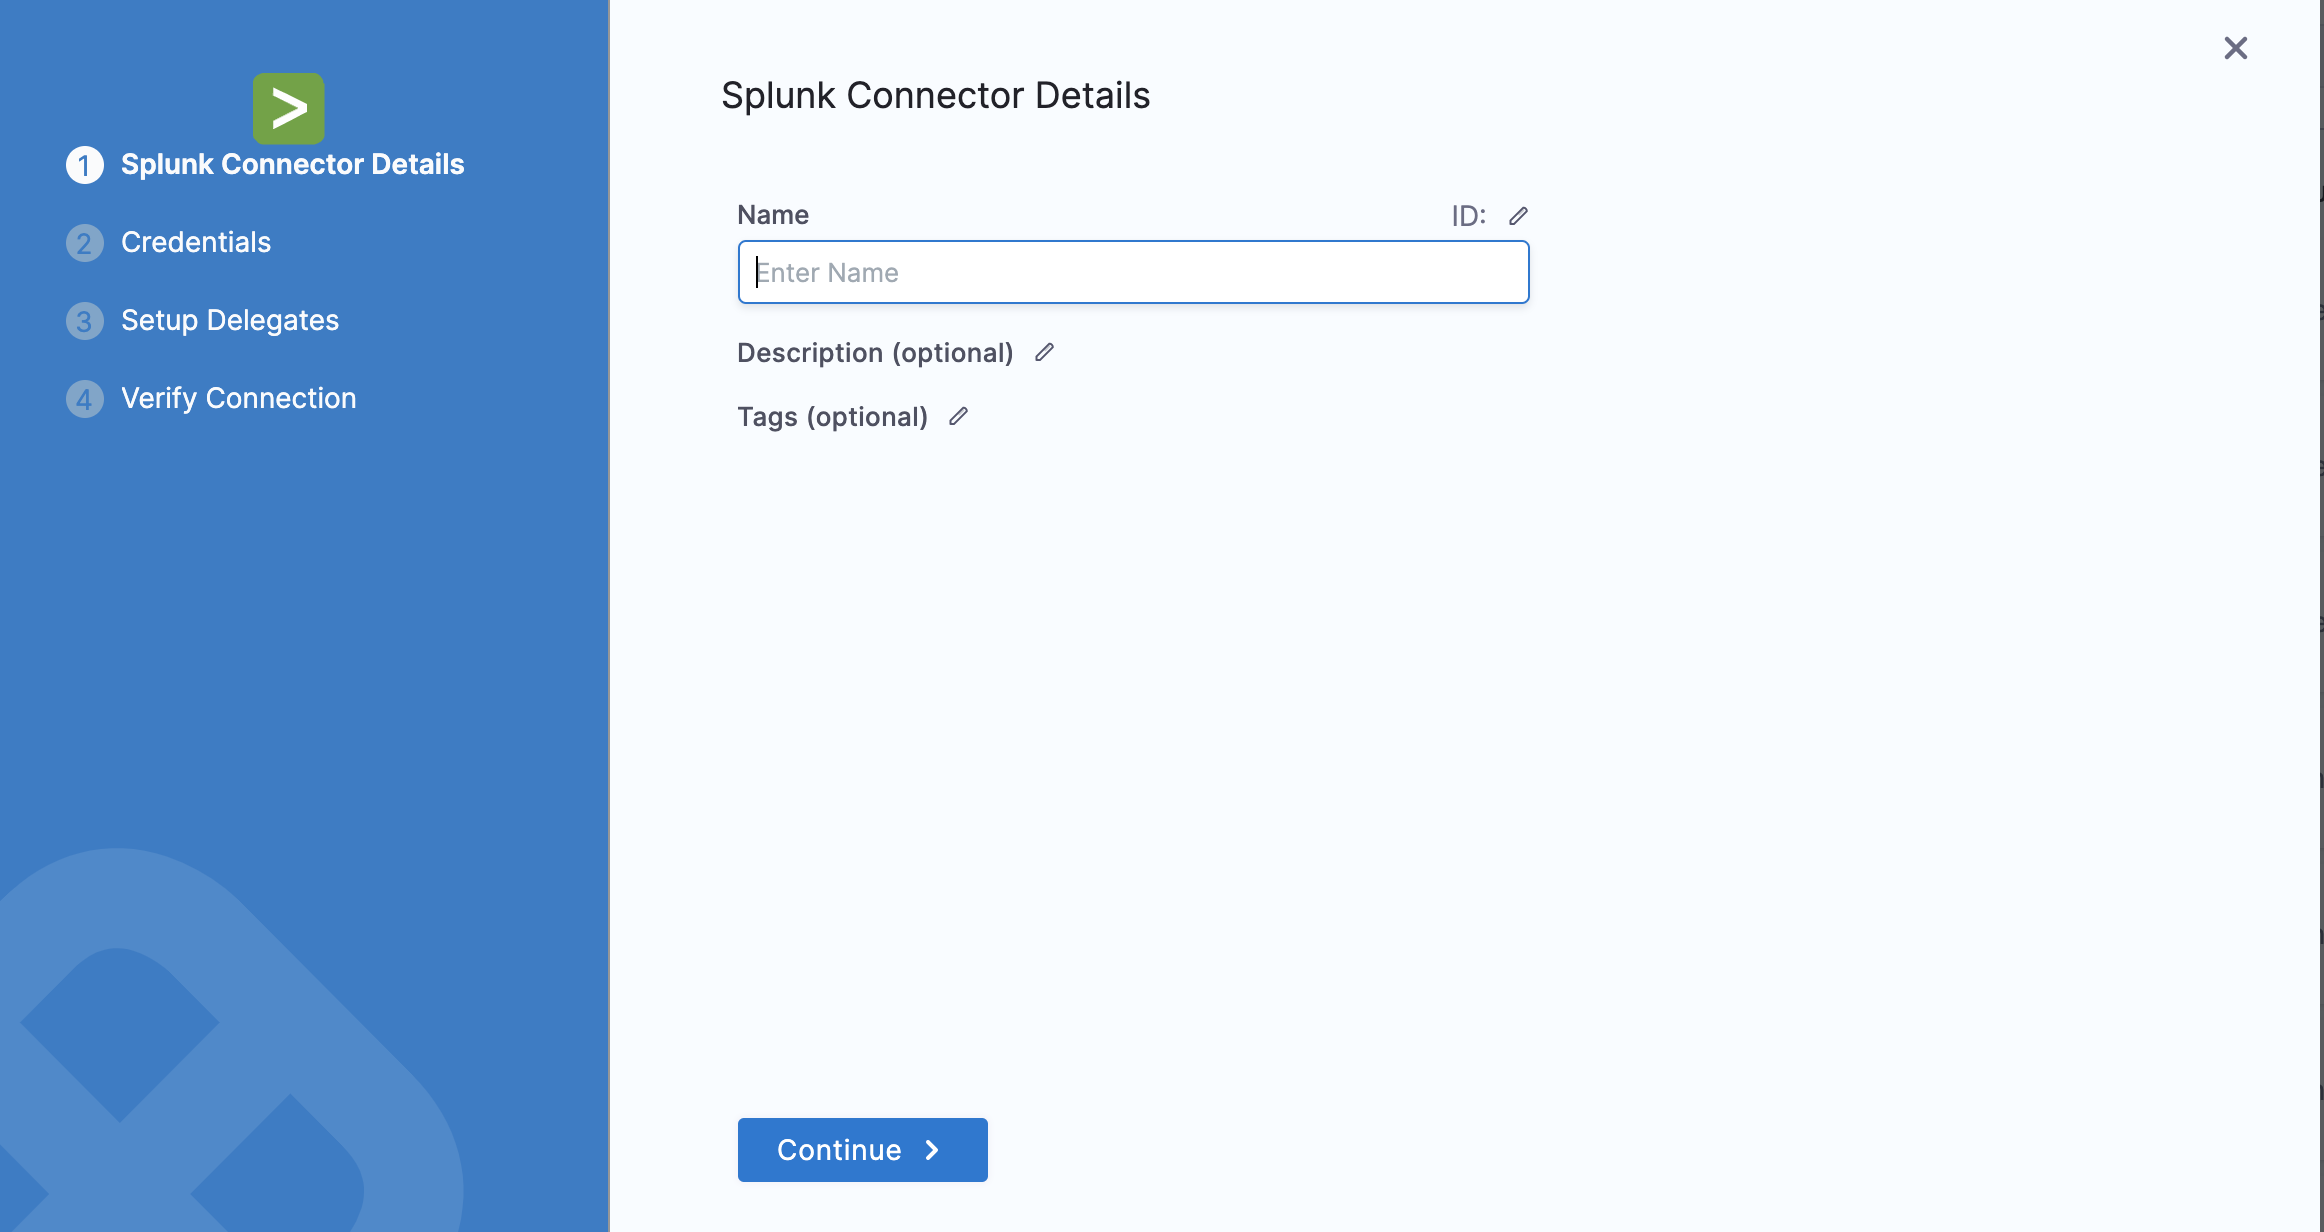
In Name, enter a name for this connector. If you are going to use multiple providers of the same type, ensure you give each provider a different name.
Click Continue.
In the URL field, enter the URL for accessing the REST API on the Splunk server. Include the port number in the format https://
.cloud.splunk.com:8089. The default port number is 8089, which is required for hosted Splunk, also. For example: https://mycompany.splunkcloud.com:8089.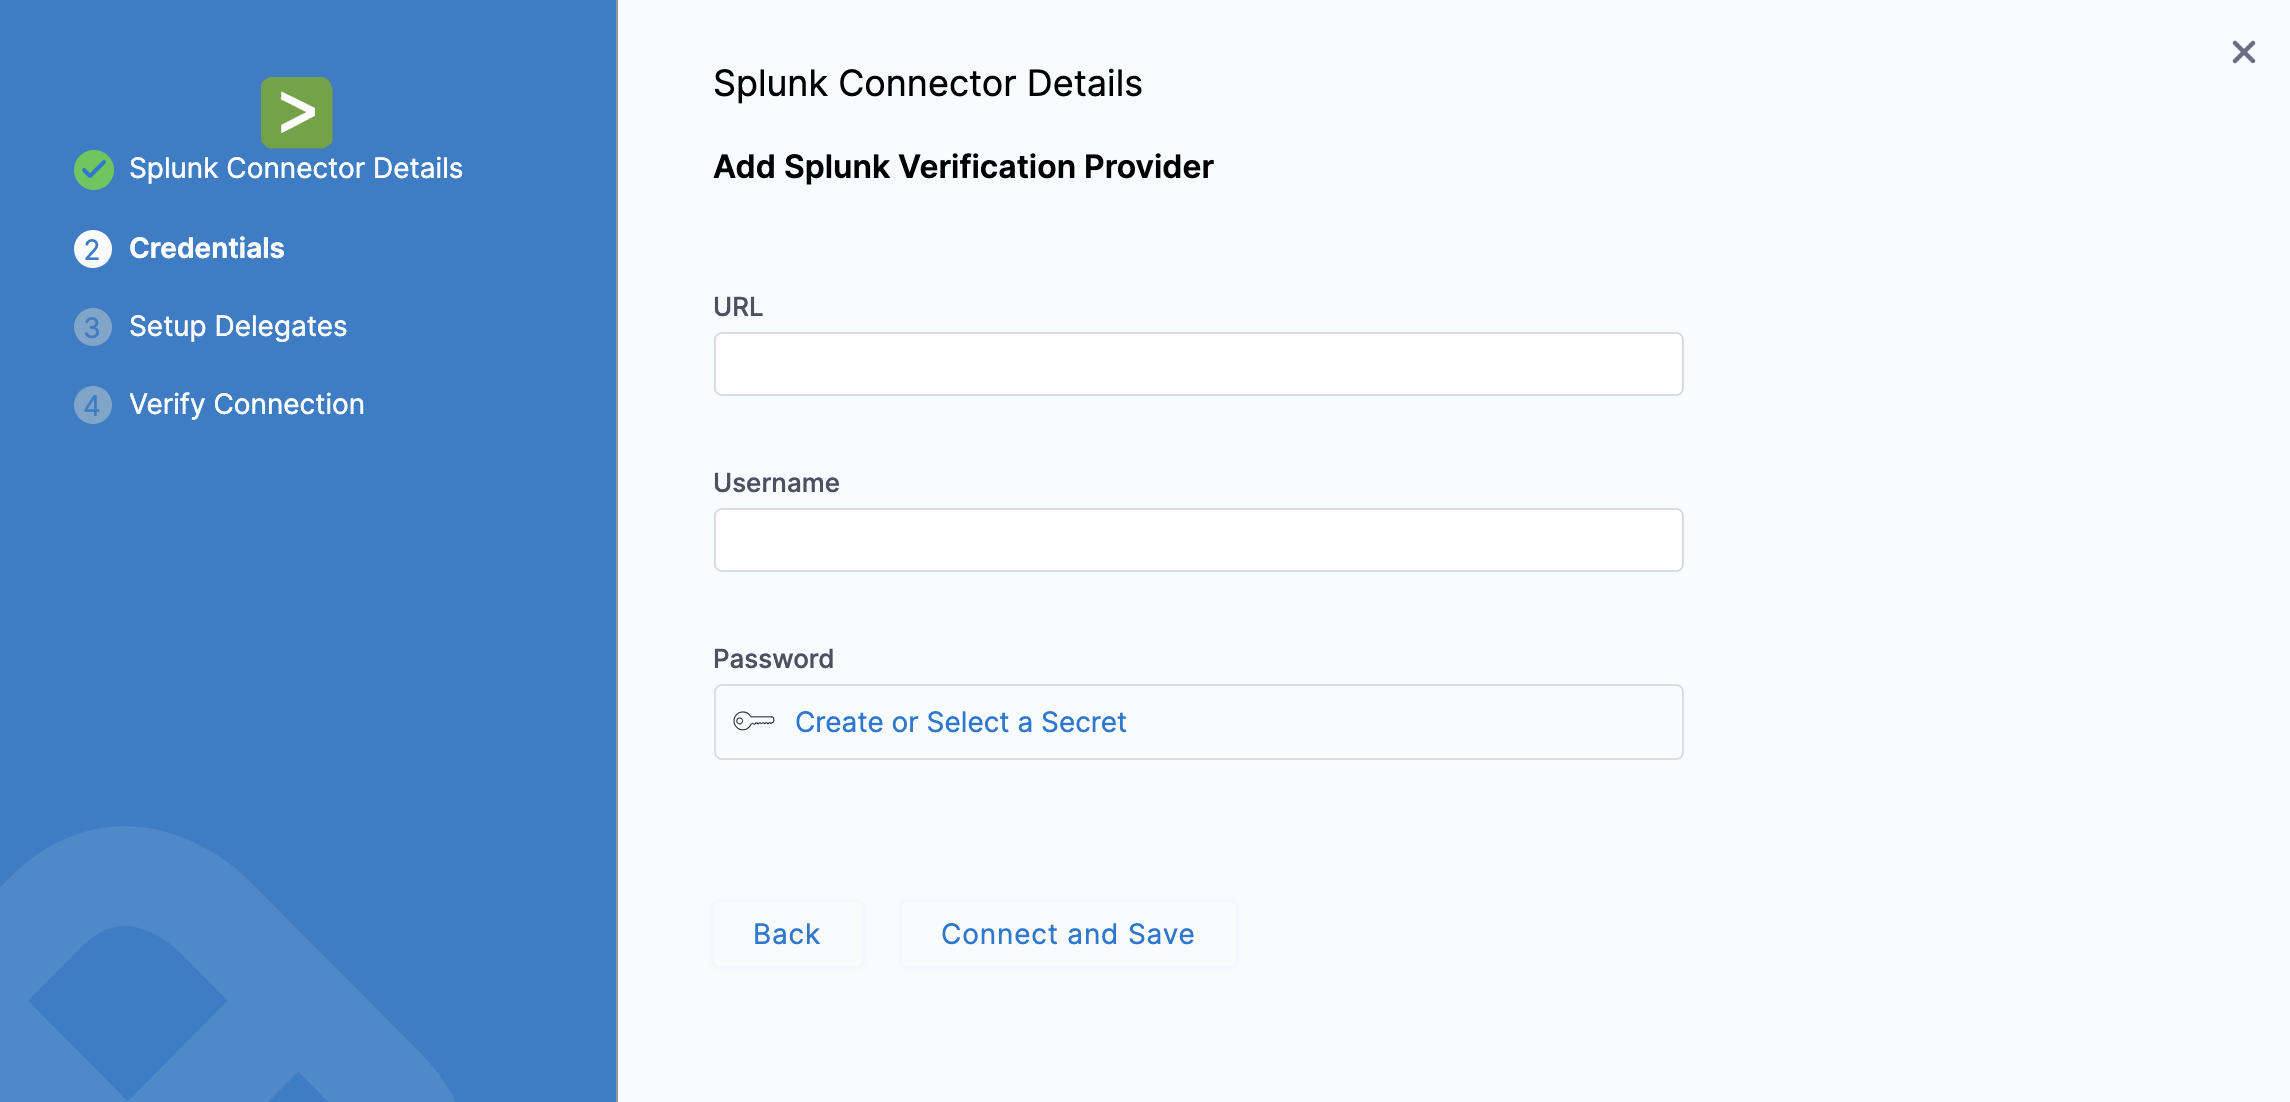
Splunk APIs require that you authenticate with a non-SAML account. To access your Splunk Cloud deployment using the Splunk REST API and SDKs, submit a support case requesting access on the Support Portal. For managed deployments, Splunk Support opens port 8089 for REST access. You can specify a range of IP addresses to control who can access the REST API. For self-service deployments, Splunk Support defines a dedicated user and sends you credentials that enable that user to access the REST API. For information see Using the REST API with Splunk Cloud.
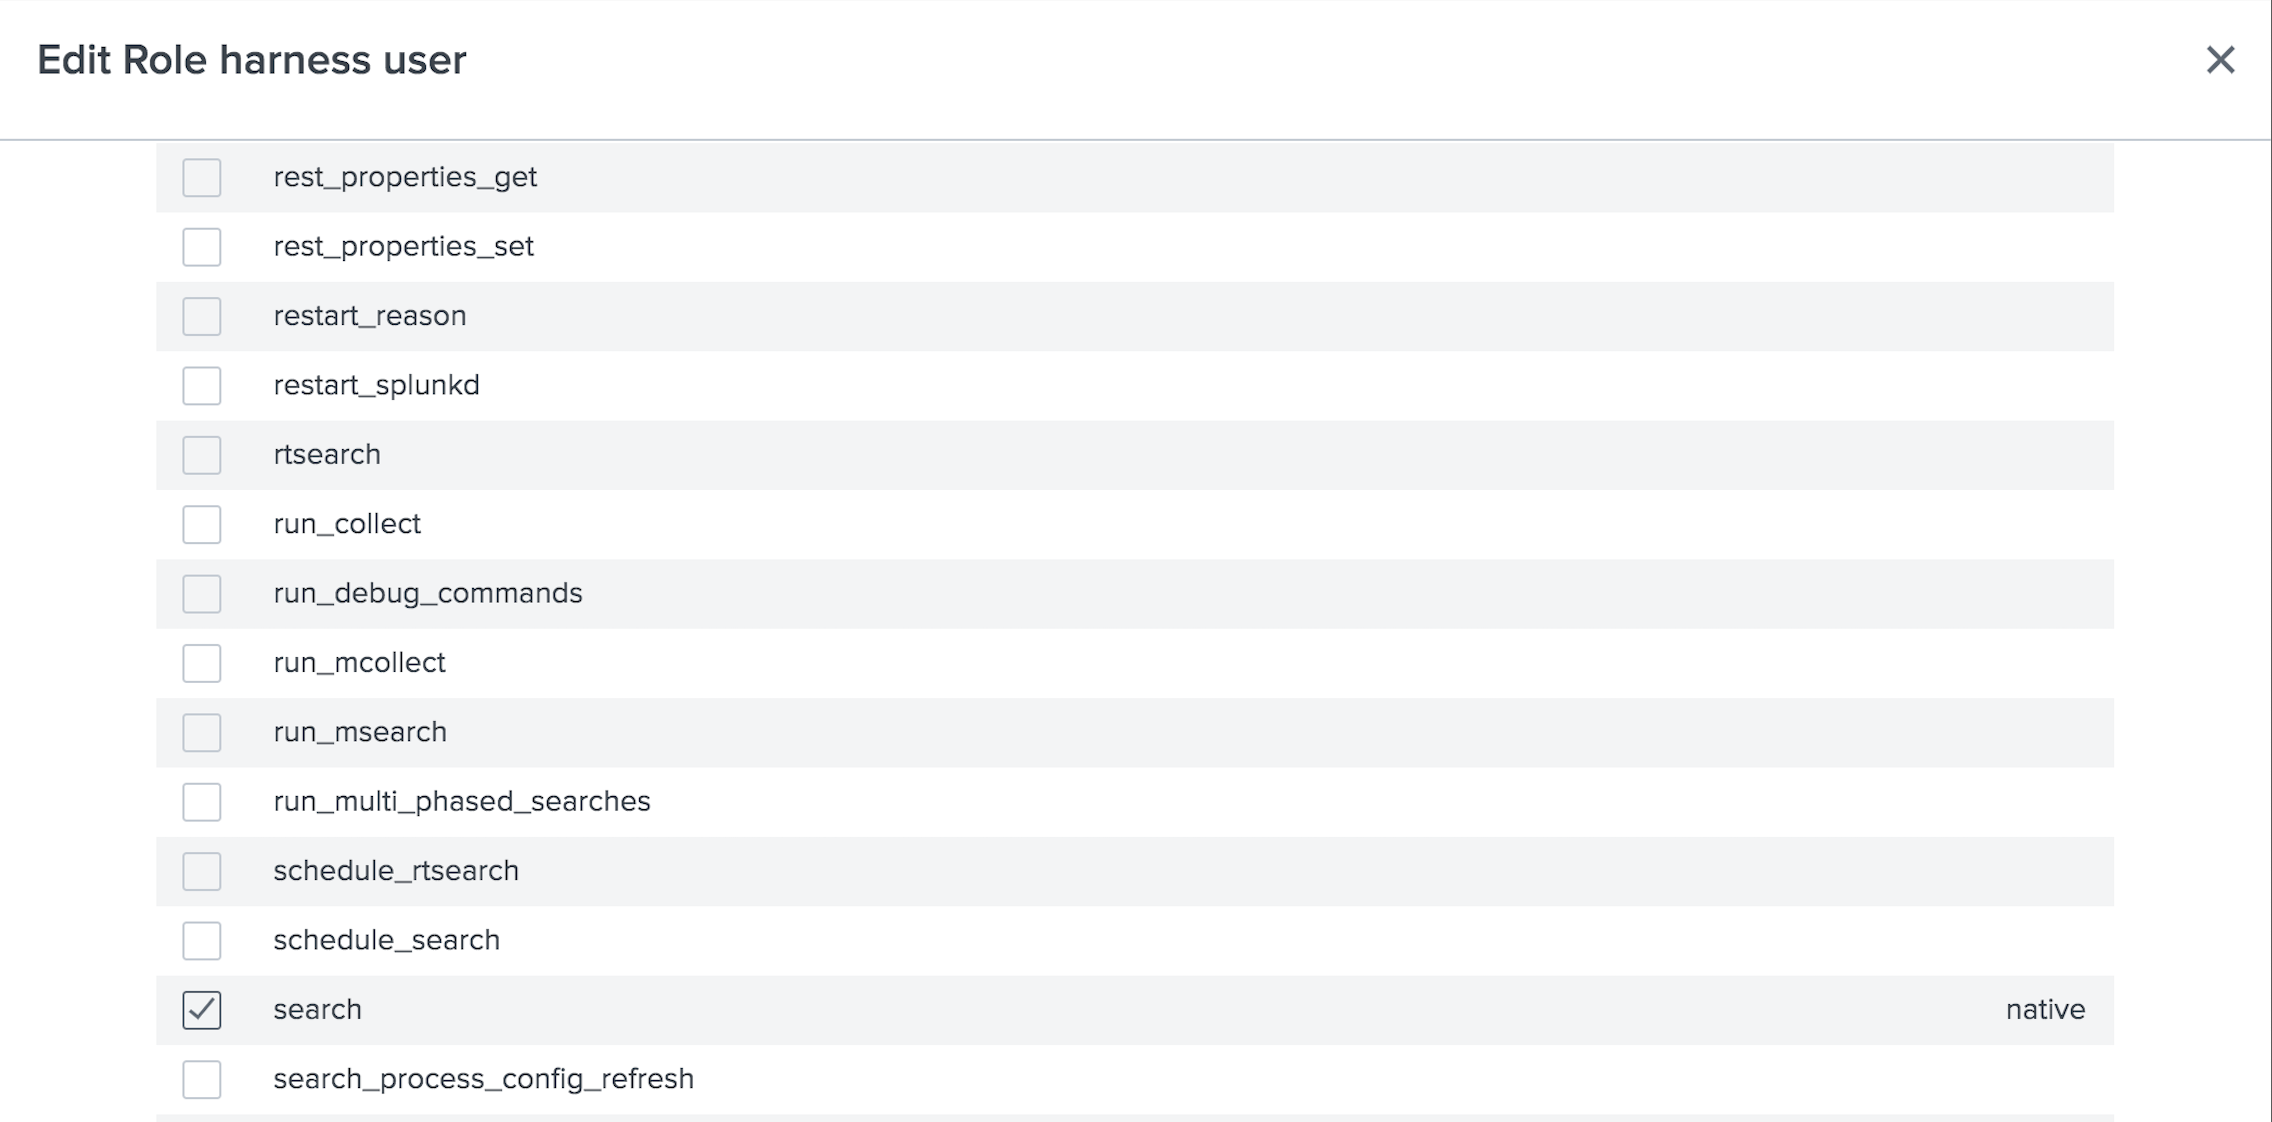
Ensure that the Splunk user account used to authenticate Harness with Splunk is assigned to a role that contains the following REST-related capabilities:
- Search.
- Access to the indexes you want to search.
In the following example we've created a new Splunk role named Harness User, and assigned it search capability:
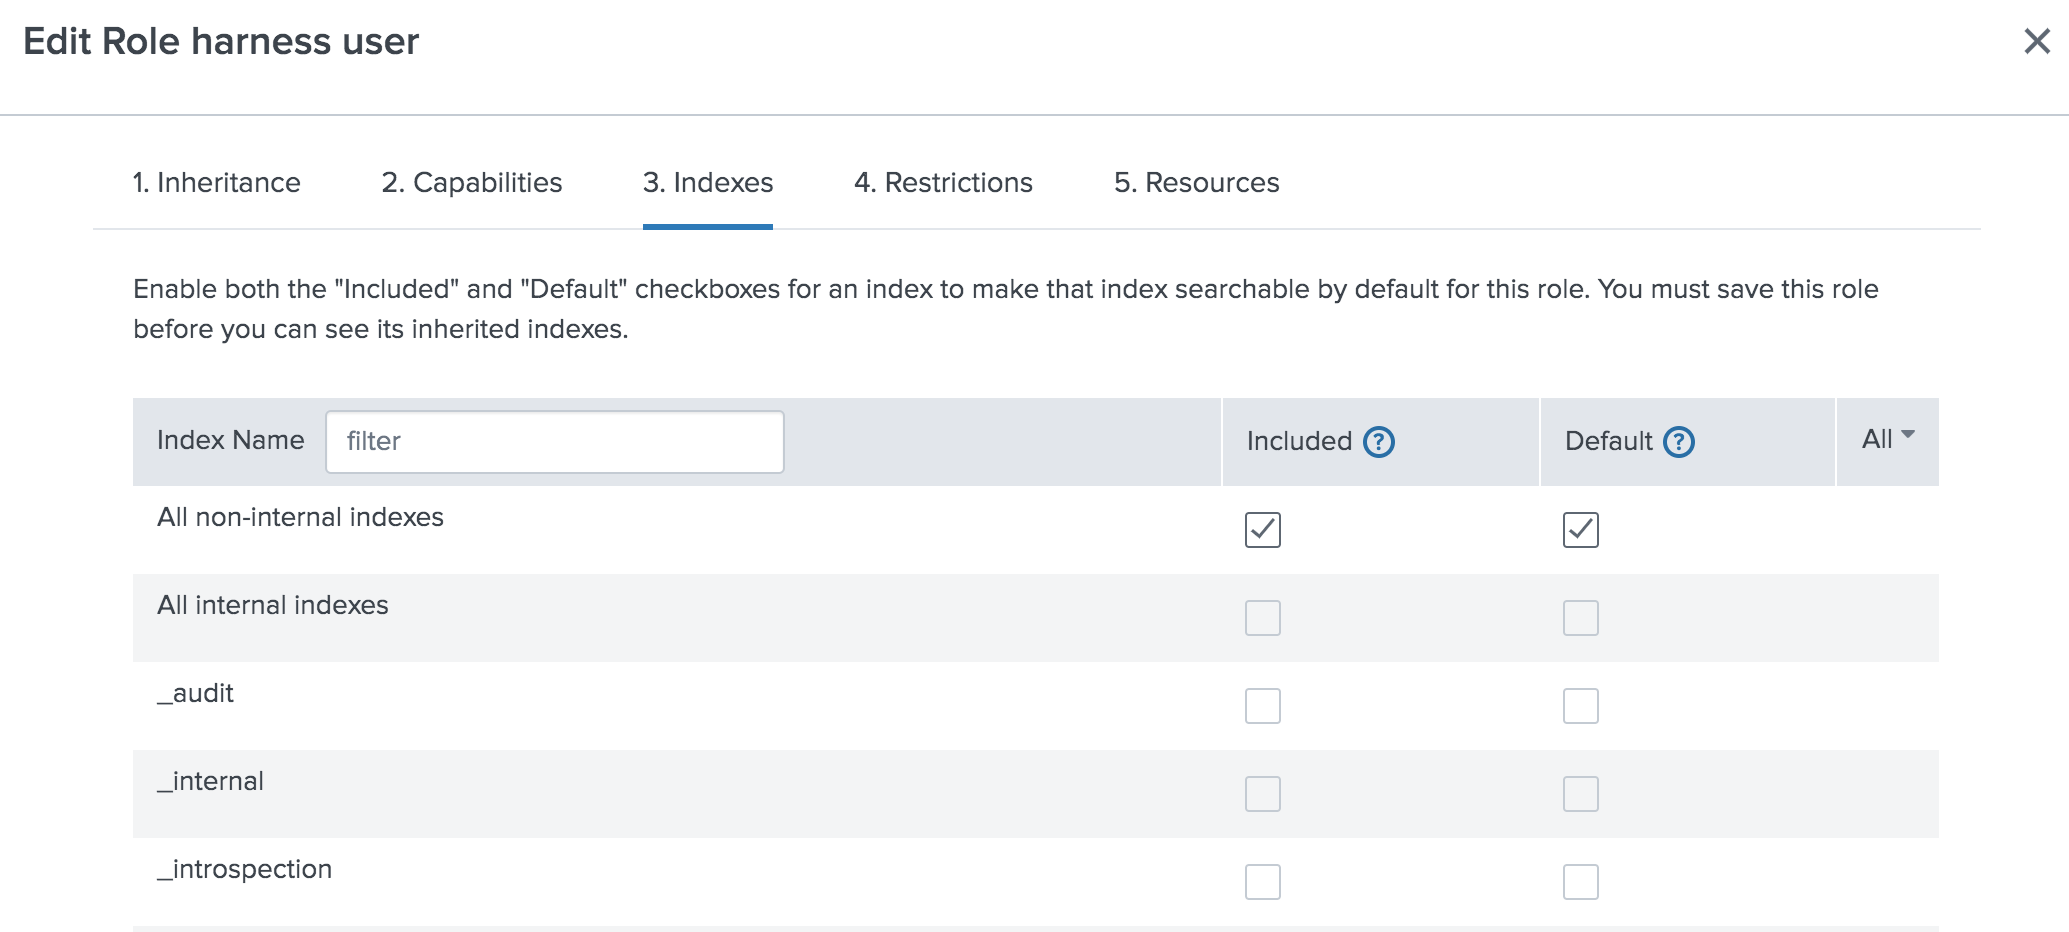
We've given this role access to All non-internal indexes. However, we could restrict the access to only the few relevant indexes:
- In the Username field, enter the username of your Splunk account.
- In Password field, you can choose Create or Select a secret.
For secrets and other sensitive settings, select or create a new Text Secret.
- Click Connect and Save. The Setup Delegates settings appear.
- You can choose Connect via any available delegate or Connect only via delegates which has all of the following tags. If you select a Delegate, Harness will always use that Delegate for this Connector.
- Click Save and Continue.
- Once the Test Connection succeeds, click Finish. Splunk is listed under the list of Connectors.
Step: Add Google Cloud Operations (formerly Stackdriver)
For details on settings and permissions, see Google Cloud Platform (GCP) Connector Settings Reference.
Google Cloud Metrics and Google Cloud Logs are supported with GCP connector. See Add a GCP Connector.
The following roles must be attached to the account used to connect Harness and Google Cloud Operations as a Google Cloud Provider:
- Stackdriver Logs - The minimum role requirement is logging.viewer
- Stackdriver Metrics - The minimum role requirements are compute.networkViewer and monitoring.viewer.
See Access control from Google.
Step: Add Datadog
Open a Harness Project.
In Project Setup, click Connectors.
Click + Connector, and click Datadog in Monitoring and Logging Systems. The Datadog connector settings appear.
In Name, enter a name for this connector. If you are going to use multiple providers of the same type, ensure you give each provider a different name.
Click Continue.
Connect to a datadog dashboard
- Copy the protocol and domain part of the URL such as https://app.datadoghq.com/
- Append a trailing
api/to create the following URLhttps://app.datadoghq.com/api/, The trailing forward slash afterapi(api/) is mandatory. Also, if your URL hasv1at the end of it, removev1. - In URL field, enter the URL
https://app.datadoghq.com/api/as indicated below :
The trailing forward slash after api (api/) is mandatory. Also, if your URL has v1 at the end of it, remove v1.
Your URL should look like one of the following :
  - `https://app.datadoghq.com/api/`
  - `https://us3.datadoghq.com/api/`
  - `https://us5.datadoghq.com/api/`
  - `https://app.datadoghq.eu/api/`
  - `https://app.ddog-gov.com/api/`
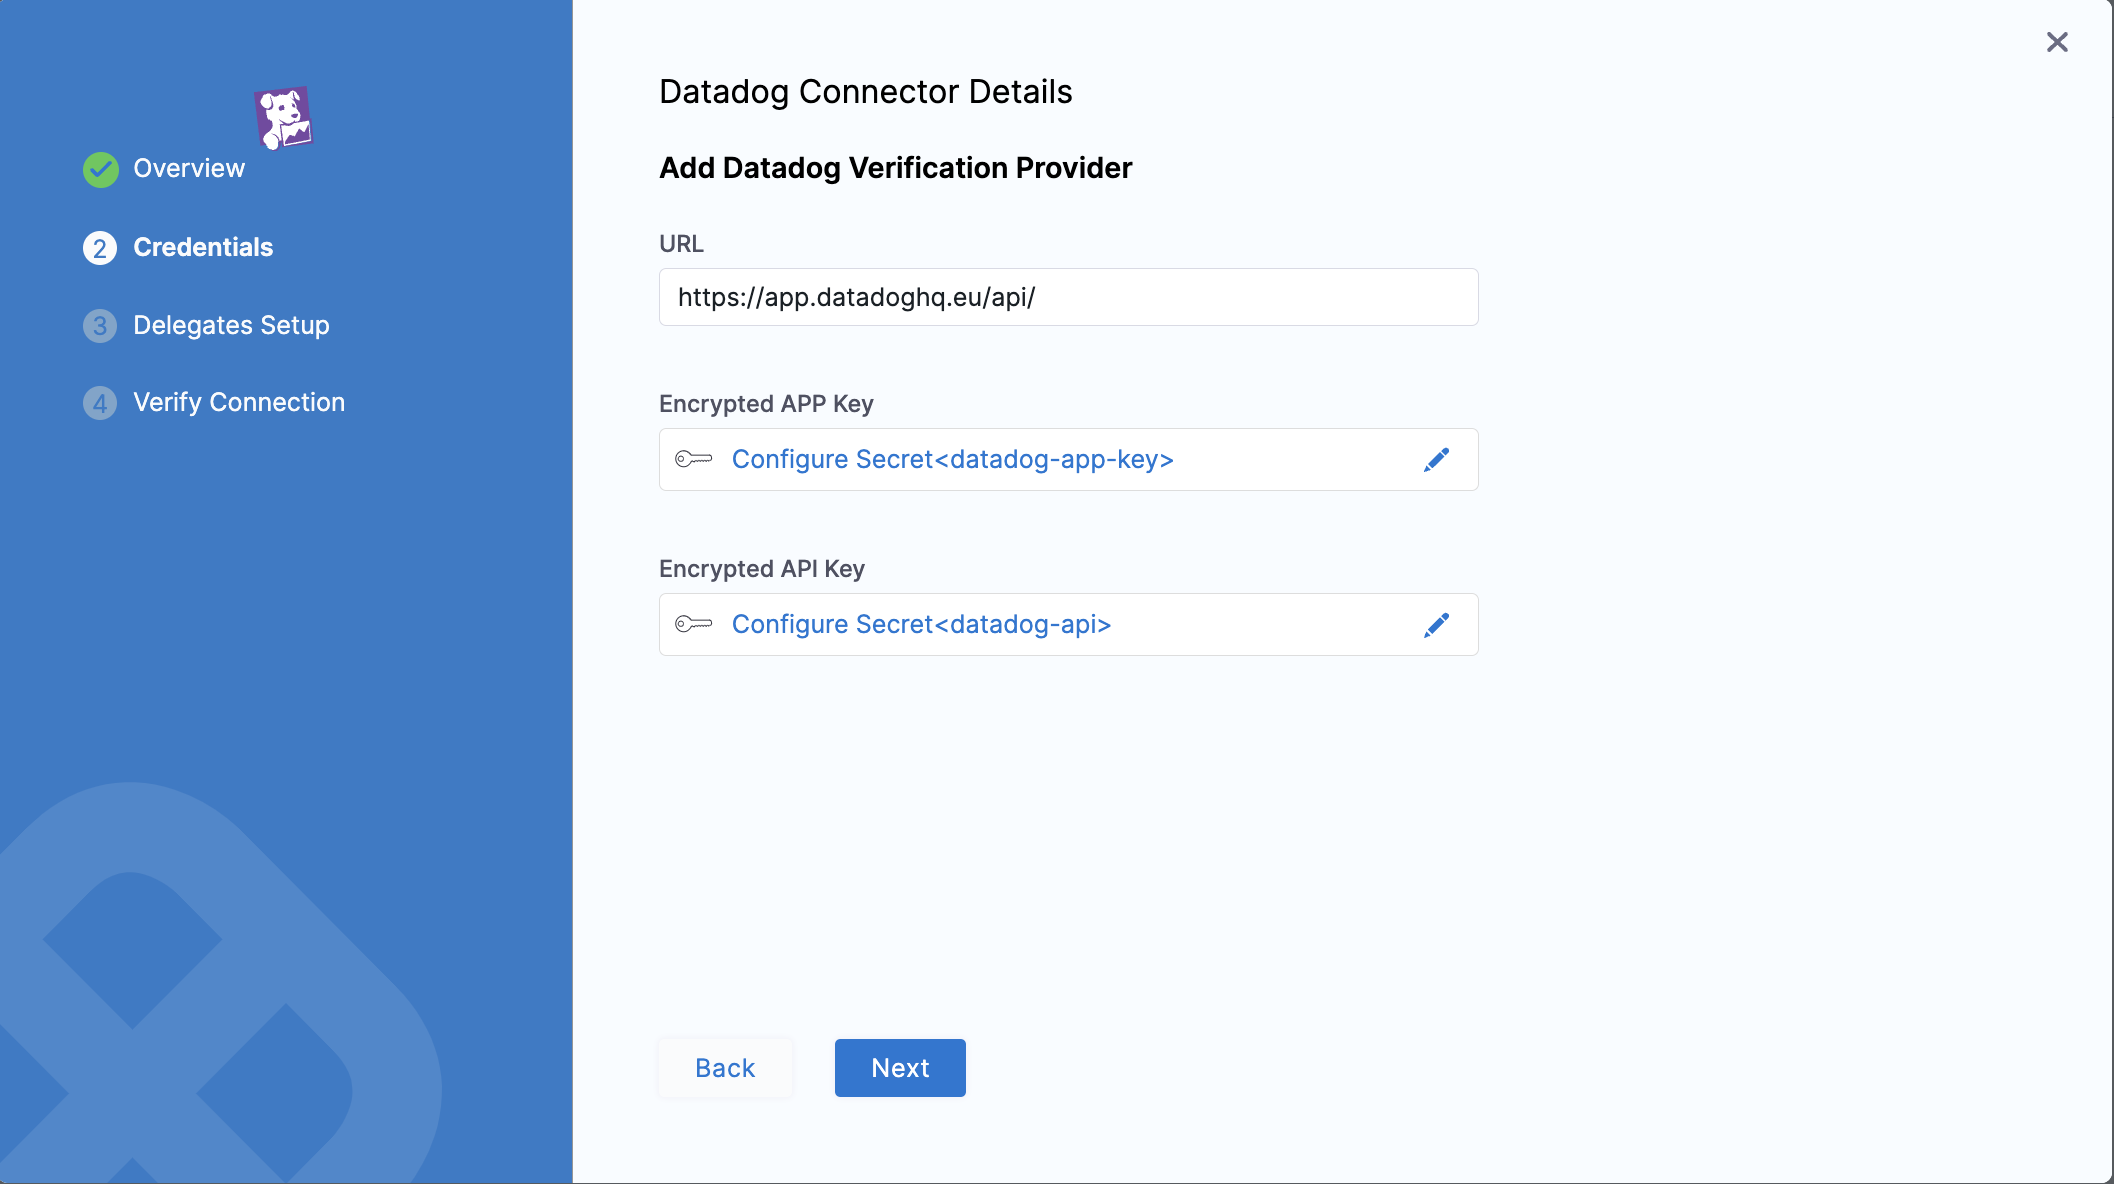
In Encrypted APP Key, enter the application key.
To create an application key in Datadog, do the following:
In Datadog, hover over Integrations, and then click APIs. The APIs page appears.
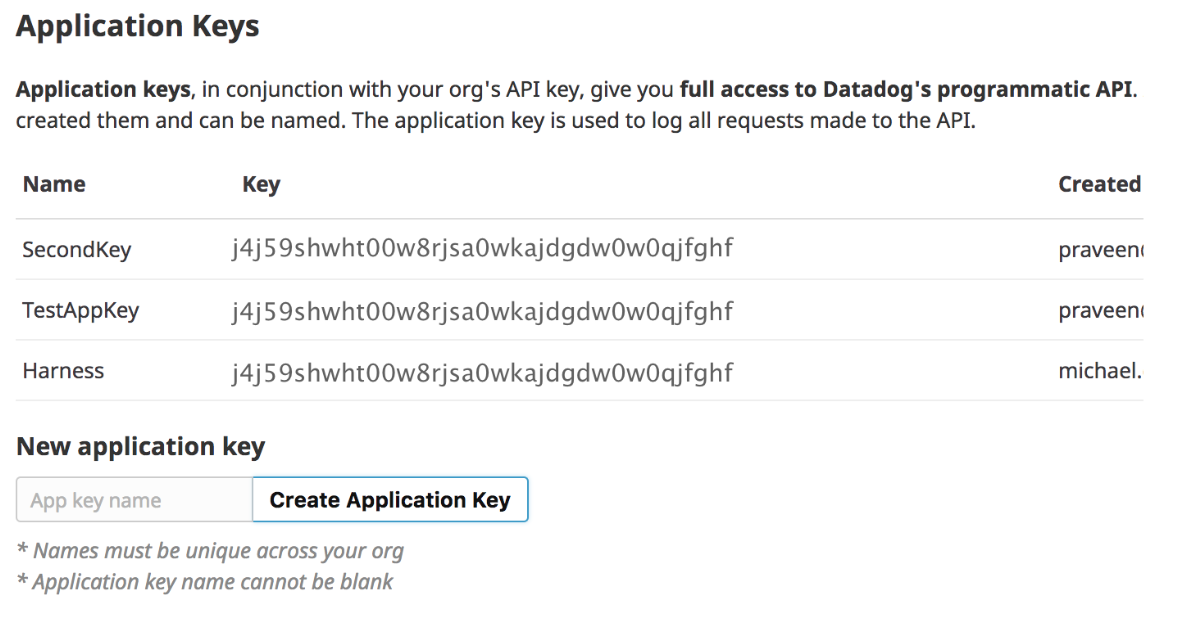
In Application Keys, in New application key, enter a name for the application key, such as Harness, and click Create Application Key.
Copy the API key and, in Harness, paste it into the Application Key field.
In Encrypted API Key, enter the API key for API calls.
To create an API key in Datadog, do the following:1. In **Datadog**, hover over **Integrations**, and then click **APIs**. The **APIs** page appears.

2. In **API Keys**, in **New API key**, enter the name for the new API key, such as **Harness**, and then click **Create API key**.
3. Copy the API key and, in **Harness**, paste it into the **API Key** field.Click Next. The Setup Delegates settings appear.
You can choose Connect via any available delegate or Connect only via delegates which has all of the following tags. If you select a Delegate, Harness will always use that Delegate for this Connector.
Click Save and Continue.
Once the Test Connection succeeds, click Finish. Datadog is listed under the list of Connectors.
Step: Add Dynatrace
Open a Harness Project.
In Project Setup, click Connectors.
Click + Connector, and click Dynatracein Monitoring and Logging Systems. The Custom Health connector settings appear.
In Name, enter a name for this connector. If you are going to use multiple providers of the same type, ensure you give each provider a different name.
Click Continue.
In URL, enter the URL of your Dynatrace account. The URL has the following syntax: https://***your_environment_ID*.live.dynatrace.com.** HTTPS is mandatory for Dynatrace connections.
In API Token, enter the API token generated in Dynatrace. To generate a Dynatrace access token, perform the following steps:
Log into your Dynatrace environment.
In the navigation menu, click Settings, and then click Integration.
Select Dynatrace API. The Dynatrace API page appears.
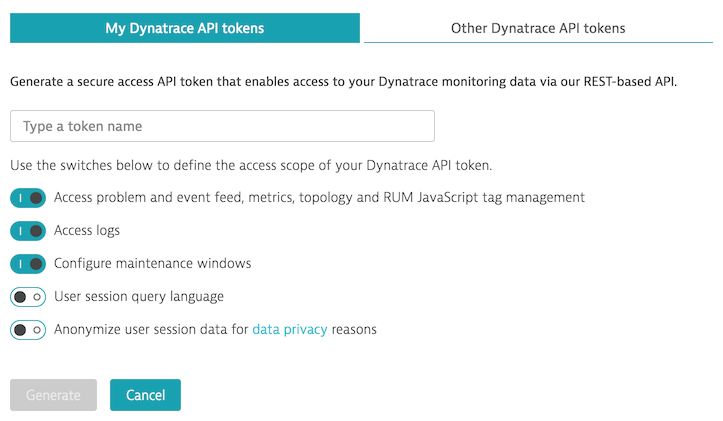
Enter a token name in the text field. The default Dynatrace API token switches are sufficient for Harness.
Click Generate. The token appears in the token list.
Click Edit. The token details appear.
Click Copy. You will use this token when connecting Harness to Dynatrace.
Click Next. The Setup Delegates settings appear.
You can choose Connect via any available Delegate or Connect only via Delegates which has all of the following tag**.** If you select a Delegate, Harness will always use that Delegate for this Connector.
Click Save and Continue.
Once the Test Connection succeeds, click Finish. Dynatrace is listed under the list of Connectors.
Step: Add Custom Health
Open a Harness Project.
In Project Setup, click Connectors.
Click + Connector, and click Custom Healthin Monitoring and Logging Systems. The Custom Health connector settings appear.
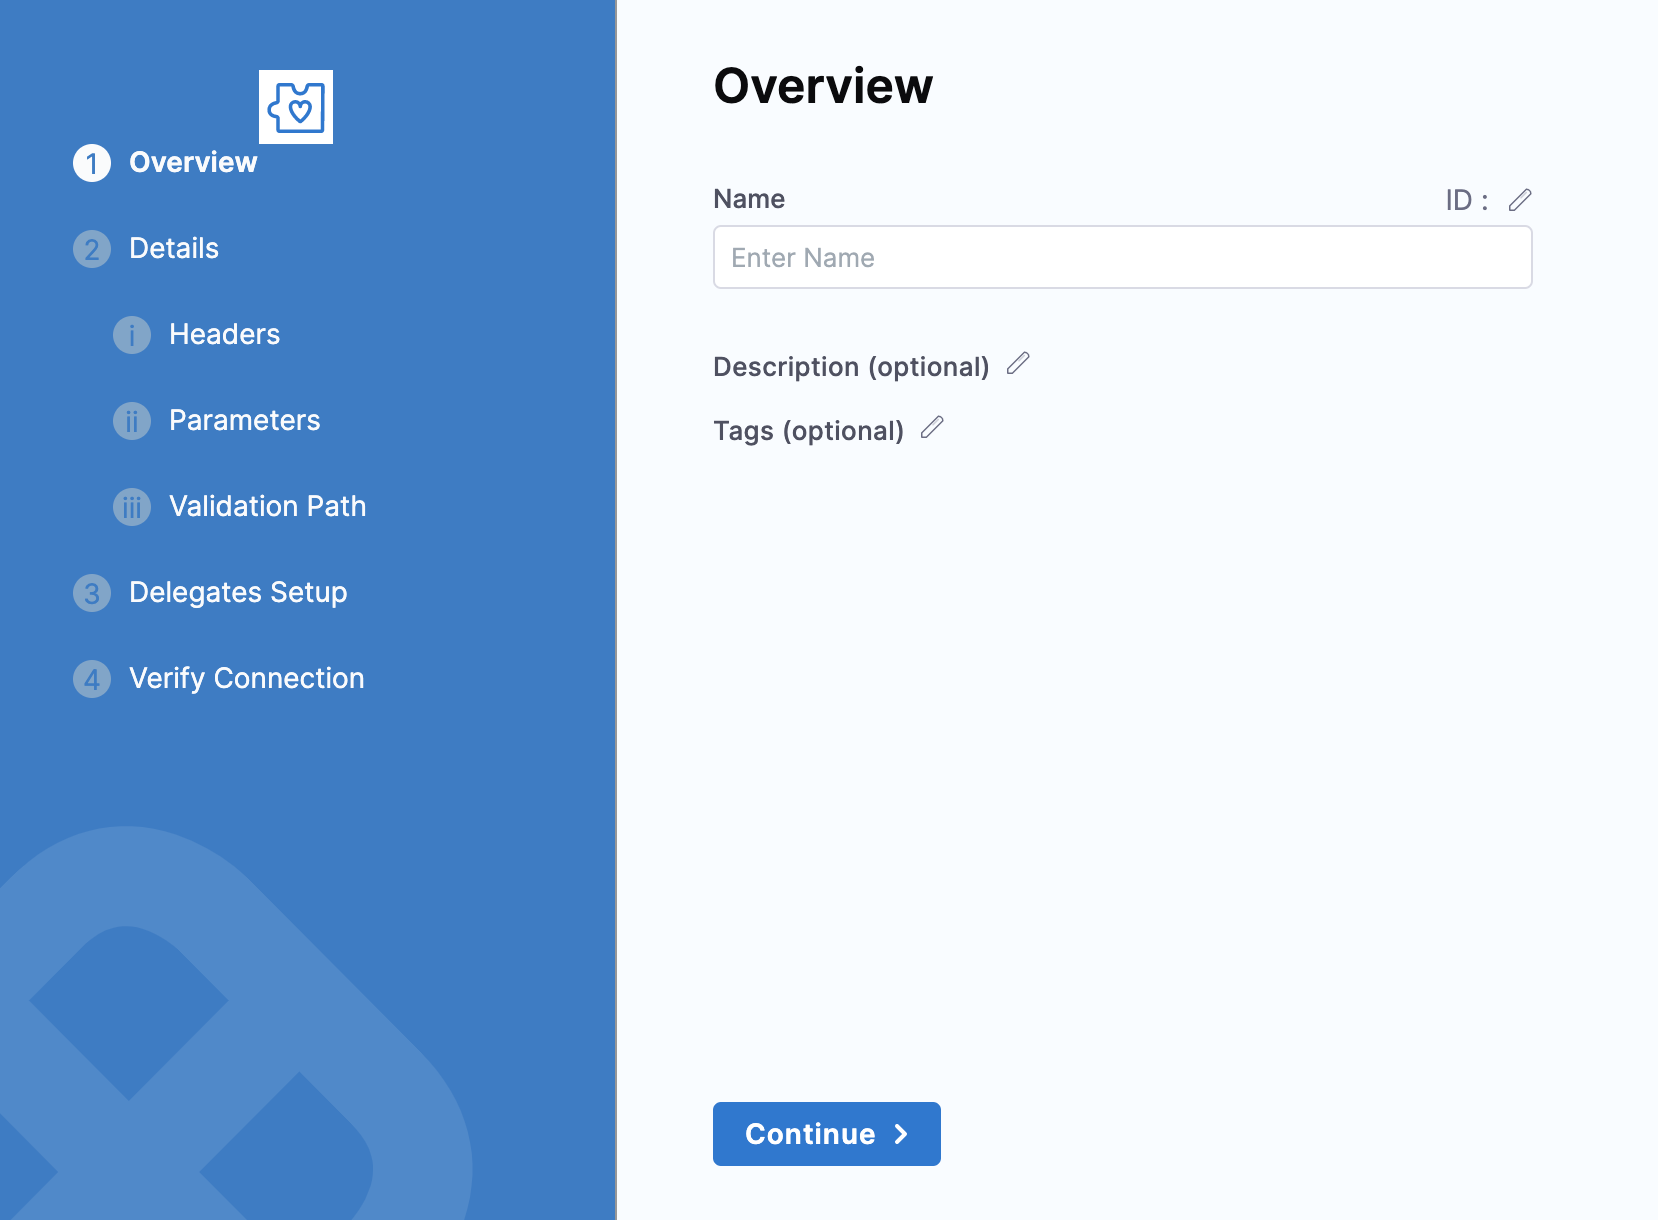
In Name, enter a name for this connector. If you are going to use multiple providers of the same type, ensure you give each provider a different name.
Click Continue.
In URL, enter the URL of the metrics data provider. For example, https://mycompany.appd.com.
In Headers, enter the query headers required by your metrics data provider. In Key, enter a valid query key. In Value, you can create or select a key by clicking Create or Select a Secret. You can also enter a Plaintext value.
Click Next. The Parameters setting appears.
In Parameters, enter the request parameters. In Key, enter a valid query key. In Value, you can create or select by clicking Create or Select a Secret or enter a Plaintext value.
Click Next. The Validation Path settings appear.
In Request Method, select GET or POST.
In Validation Path, enter the query string from your metric provider.
Click Next. The Setup Delegates settings appear.
You can choose Connect via any available Delegate or Connect only via Delegates which has all of the following tag**.** If you select a Delegate, Harness will always use that Delegate for this Connector.
Click Save and Continue.
Once the Test Connection succeeds, click Finish. Custom Health is listed under the list of Connectors.