Monitoring options
Monitor the infrastructure components of your Harness Self-Managed Enterprise Edition installation by bringing your own open-source monitoring system, such as Prometheus, and integrating with observability tools, such as Grafana.
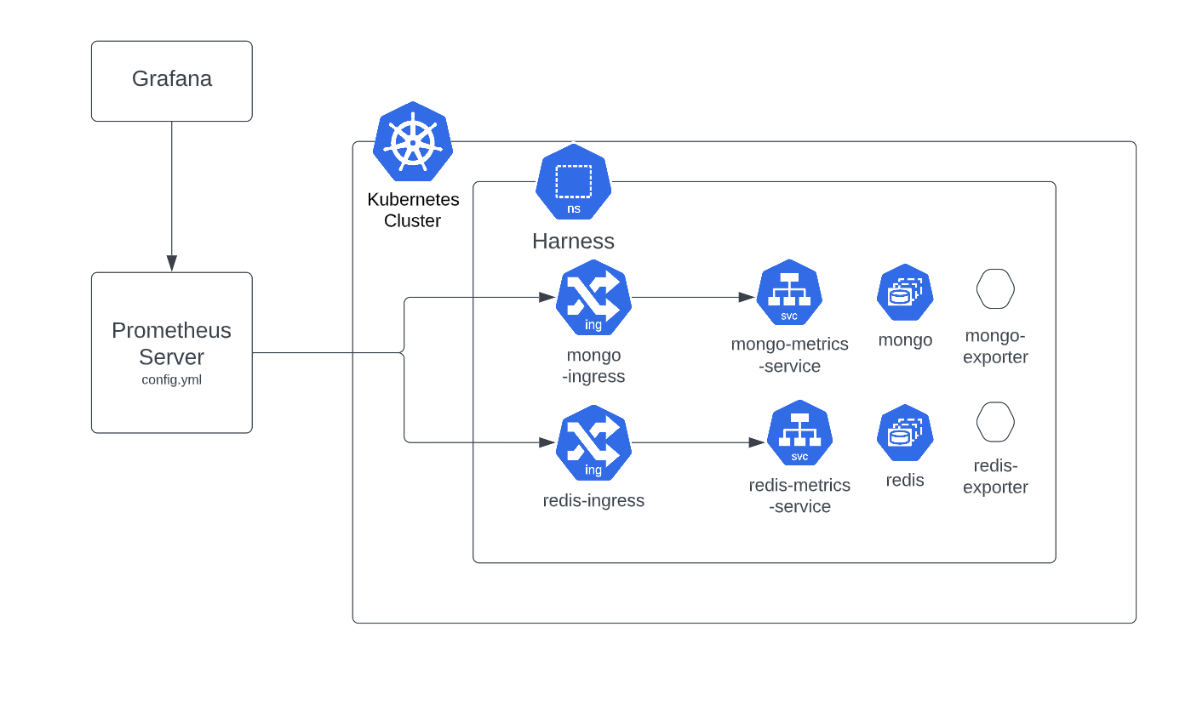
To demonstrate how you can monitor database applications, like MongoDB, Postgres, or Redis, for the Harness Self-Managed Enterprise Edition, this topic describes how you can use a Prometheus server installed in a Kubernetes cluster outside of Harness services. In this example, the monitored target application is present in one cluster, and Prometheus and Grafana are installed in another cluster.
The example setup uses two clusters to demonstrate the use of an ingress controller using LoadBalancer with an external Prometheus server.
Requirements
This example setup requires:
- Kubernetes 1.22+ (Harness recommends 1.23)
- Helm 3.2.0+
- Prometheus version: Bitnami/kube-prometheus 8.4.0+
- Istio version 1.15.3
- Nginx version v1.0.0-alpha.2
For this example, we use the Prometheus operator packaged by Bitnami as an external Prometheus setup.
Configure metrics and ingress rules
Follow the steps below on the Kubernetes cluster where you deploy your Harness instance:
Add the following overrides to enable database metrics. This updates your Harness installation and your existing overrides.
platform:
   mongodb:
     metrics:
       enabled: true
   timescaledb:
     prometheus:
       enabled: true
   redis:
     metrics:
       enabled: true
Create an ingress file for
metrics, with defined routing rules that forward requests to an internal service exposing metrics with a similar configuration.apiVersion: networking.k8s.io/v1
kind: Ingress
metadata:
name: mongo-metrics
namespace: gcloud
annotations:
nginx.ingress.kubernetes.io/whitelist-source-range: "10.116.1.26"
nginx.ingress.kubernetes.io/rewrite-target: /$2
spec:
ingressClassName: harness
rules:
- http:
paths:
- path: /mongo-metrics
pathType: ImplementationSpecific
backend:
service:
name: mongodb-replicaset-chart-metrics
port:
number: 9216noteAdd your IPs to your allow list so the metrics exposed by the ingress are only accessible internally. The IP included in the allow list is the external IP for the node where you host Prometheus in a separate cluster.
Configure Prometheus to integrate with Harness
To integrate Prometheus with your Harness instance, follow the instructions below for your type of installation:
- Kubernetes operator by Bitnami
- Standalone prometheus
To use a Kubernetes operator by Bitnami, do the following:
Under Custom Resources → monitoring.coreos.com → Prometheus, make the following changes to the CRD to enable adding additional scrape configs under
spec.additionalScrapeConfigs.Provide the name of the secret you want to add in the
config.yamlfile.spec:
additionalScrapeConfigs:
key: config.yml
name:harness-metricsCreate a
harness-metricssecret in the same namespace where the Prometheus operator is installed. This secret passes aconfig.yamlfile as the data. The data contains the job for theadditionalScrapeConfigsin the following manner.- job_name:mongo-metrics-test
scrape_interval:30s
metrics_path: /mongo-metrics/metrics
static_configs:
- targets:
- <LB-IP>
- job_name:redis-metrics-test
scrape_interval:30s
metrics_path: /redis-metrics/metrics
static_configs:
- targets:
- <LB-IP>
- job_name:postgres-metrics-test
scrape_interval:30s
metrics_path: /postgres-metrics/metrics
static_configs:
- targets:
- <LB-IP>Run the following command to create the secret:
kubectl create secret generic harness-metrics --from-file config.yml -n <Namespace>Prometheus can now scrape the metrics for MongoDB on the URL:
http://<LB-IP>/mongo-metrics/metrics.noteBecause the URL is on your allow list, other users are not able to view the internal metrics of specific infra components, such as MongoDB.
If you have Prometheus installed, you can make changes directly to your Prometheus config.yaml file by adding fields under scrape configs.
To use a standalone Prometheus installation with a customer configuration, do the following:
Update your
config.yamlfile with the following settings:scrape_configs:
- job_name:mongo-metrics-test
scrape_interval:30s
metrics_path:/mongo-metrics/metrics
static_configs:
- targets:
- <LB-IP>
- job_name:redis-metrics-test
scrape_interval:30s
metrics_path:/redis-metrics/metrics
static_configs:
- targets:
- <LB-IP>
- job_name:postgres-metrics-test
scrape_interval:30s
metrics_path:/postgres-metrics/metrics
static_configs:
- targets:
-<LB-IP>
View metrics on the Granfana dashboard
To visualize metrics from various sources, you can import Grafana dashboards.
Follow the below steps on your Kubernetes cluster to deploy Grafana:
Install Grafana using the Helm chart.
helm repo add grafana https://grafana.github.io/helm-charts
helm repo update
helm install grafana grafana/grafana -n <Namespace>
Using Grafana operator - Install a bitnami packaged Grafana Operator, documentation steps are mentioned here - Grafana Operator Installation.
Open the Grafana dashboard
Decode the secret. The login username is
adminby default.Execute the port-forward command to host Grafana locally on port 3000.
kubectl get secret --namespace <Namespace> grafana -o jsonpath="{.data.admin-password}" | base64 --decode ; echo
export POD_NAME=$(kubectl get pods --namespace <Namespace> -l "app.kubernetes.io/name=grafana,app.kubernetes.io/instance=grafana" -o jsonpath="{.items[0].metadata.name}")
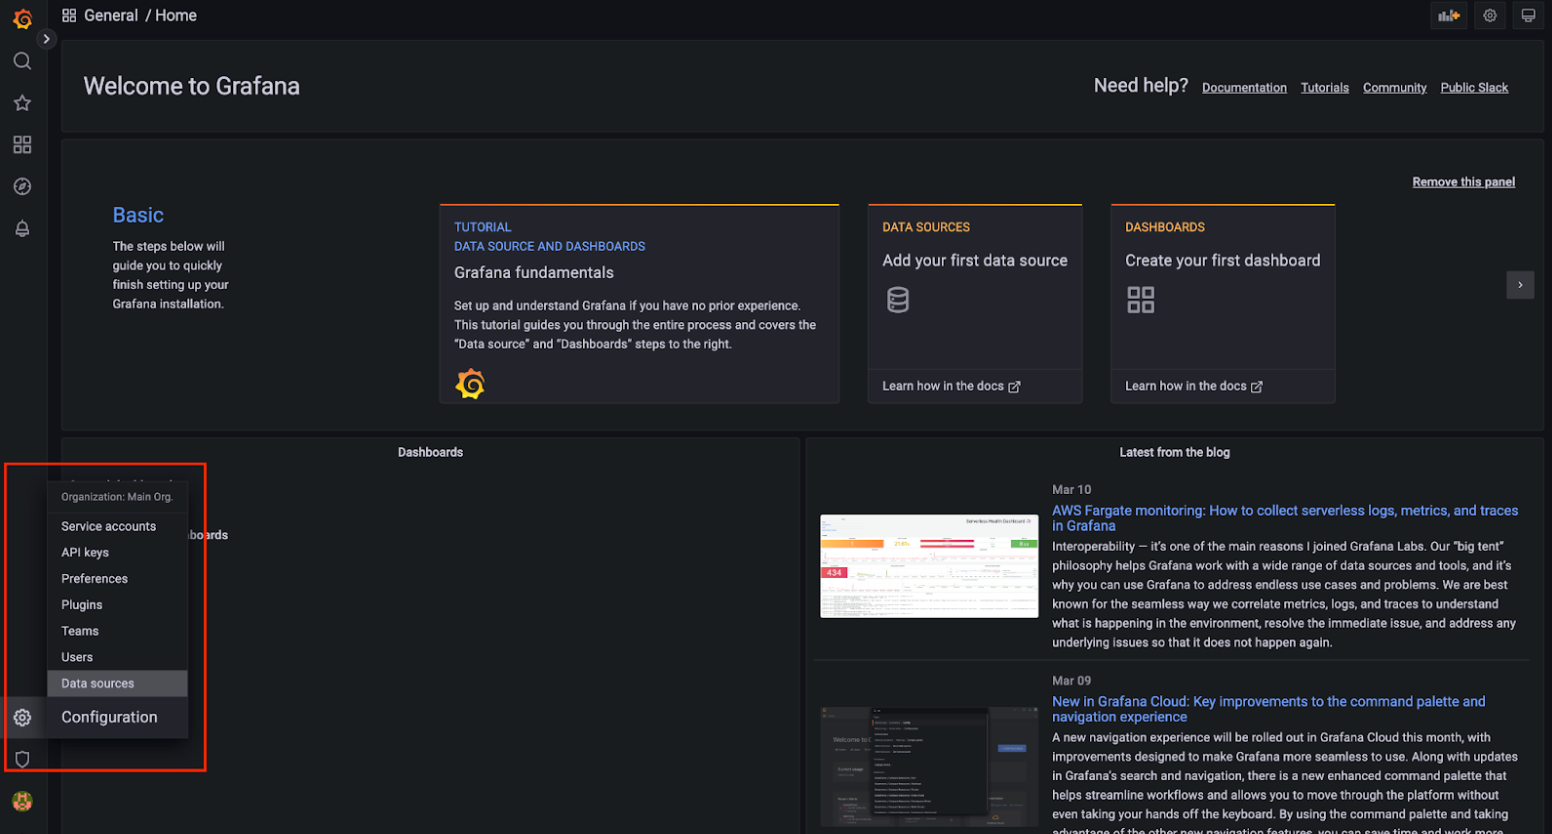
kubectl --namespace default port-forward $POD_NAME 3000Sign in to the Grafana dashboard home page.
Set Prometheus as the datasource:
Go to settings, select Data sources. Then, select Add data source. Select Prometheus.
Configure the URL settings to connect to your locally-hosted Prometheus setup, with the locally-hosted Grafana instance.
Deploy prometheus and grafana on the same cluster, and use kubeDNS resolution. For example, if you want to connect pod A to pod B, on pod A, the hostname of B should be:
http://serviceNameOfPodB.<namespaceOfPodB>.svc.cluster.local:<port>This requires the following information:
- Service name of where prometheus is hosted.
- Namespace in which prometheus is hosted.
- Port at which prometheus is hosted.
This makes our present URL look like:
http://my-release-kube-prometheus-prometheus.default.svc.cluster.local:9090/cautionThe final URL should be similar to the above URL, according to your system specifications. Any extra space or character in the URL field causes the data source testing to fail.
Configure the Prometheus type and Prometheus version fields.
Select Save & test. A confirmation that the data source is working displays.
Add a Grafana dashboard
Now you can add a dashboard to view metrics via query.
- To add a dashboard, go to Go to Dashboards and then select New Dashboard and Add a new panel.
Here are some sample open source dashboards: