New Relic
Harness CV integrates with New Relic to:
- Verify that the deployed service is running safely and performing automatic rollbacks.
- Apply machine learning to every deployment to identify and flag anomalies in future deployments.
This topic covers how to add and configure New Relic as a Health Source for the Verify step.
Before You Begin
Review: CV Setup Options
To use the Verify step, you will need a Harness Service Reliability Management Monitored Service. In the simplest terms, a Monitored Service is basically a mapping of a Harness Service to a service monitored by your APM or logging tool.
You can set up a Monitored Service in the Service Reliability Management module or in the Verify step in a CD stage. The process is the same.
No matter where you set up the Monitored Service, once it's set up, it's available to both Service Reliability Management and CD modules.
In this topic we'll set up the Monitored Service as part of the Verify step.
Step 1: Add Verify Step
There are two ways to add the Verify step:
- When selecting the stage deployment strategy:
The Verify step can be enabled in a CD stage the first time you open the Execution settings and select the deployment strategy. When you select the deployment strategy you want to use, there is also an Enable Verification option. Select the Enable Verification option.
Harness will automatically add the Verify step. For example, here is a stage where Canary strategy and the Enable Verification option were selected.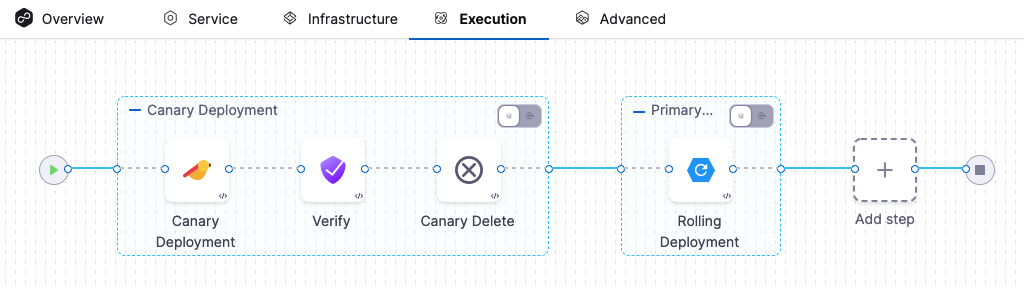
- Add the Verify step to an existing Execution setup: You can also add the Verify step to the Execution section of a CD stage in a Pipeline you previously created. Simply click Add Step after the deployment step, and then select Verify.

Step 2: Enter a Name and Timeout
In Name, enter a name for the step.
In Timeout, enter a timeout value for the step.
You can use:
wfor weeksdfor dayshfor hoursmfor minutessfor secondsmsfor milliseconds
The maximum is 53w.Timeouts can be set at the Pipeline level also.
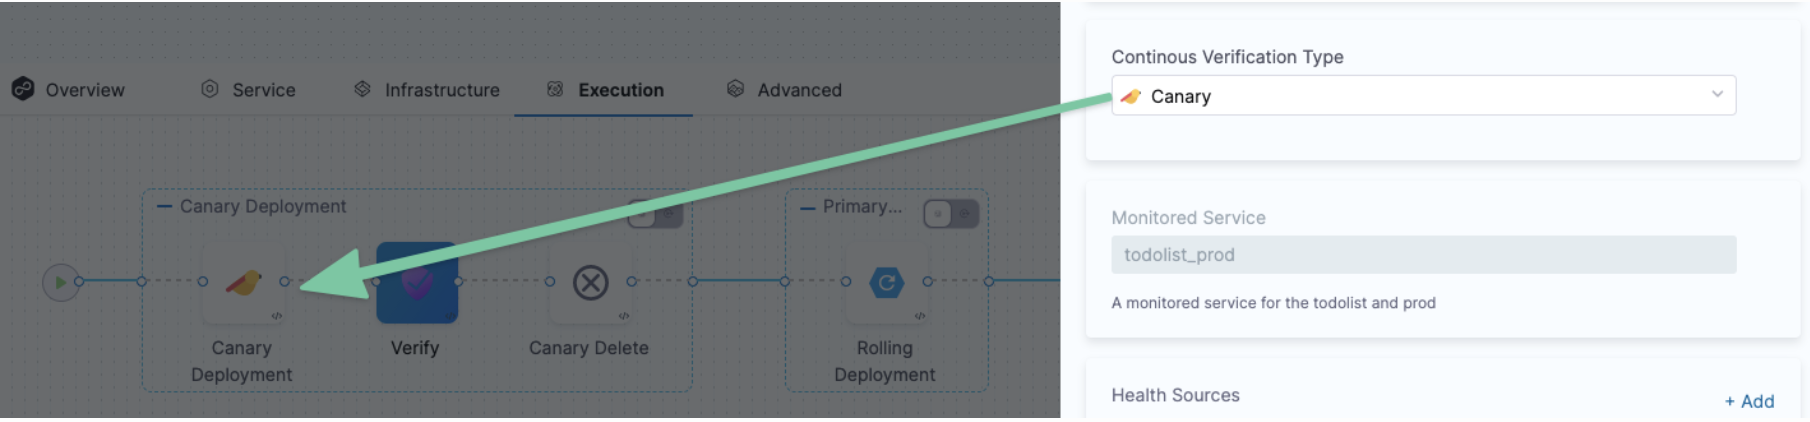
Step 3: Select a Continuous Verification Type
In Continuous Verification Type, select a type that matches your deployment strategy
Step 4: Create a Monitored Service
In Monitored Service, click Click to autocreate a monitored service.
The option to auto-create a monitored service is not available if you have configured either a service, an environment, or both as runtime values. When you run the pipeline, Harness concatenates the service and environment values you enter in the runtime inputs screen and generates a monitored service name. If a monitored service with the same name exists, Harness assigns it to the pipeline. If no monitored service that matches the generated monitored service name exists, Harness skips the verification step.
For example, suppose you enter the service as todolist and the environment as dev. In that case, Harness generates the monitored service name todolist_dev, checks whether a monitored service with the name todolist_dev is available, and assigns it to the pipeline. If no monitored service is available with the name todolist_dev, Harness skips the verification step.
Step 5: Add Health Sources
This option is available only if you have configured the service and environment as fixed values.
A Health Source is basically a mapping of a Harness Service to the service in a deployment environment monitored by an APM or logging tool.
In Health Sources, click Add. The Add New Health Source settings appear.
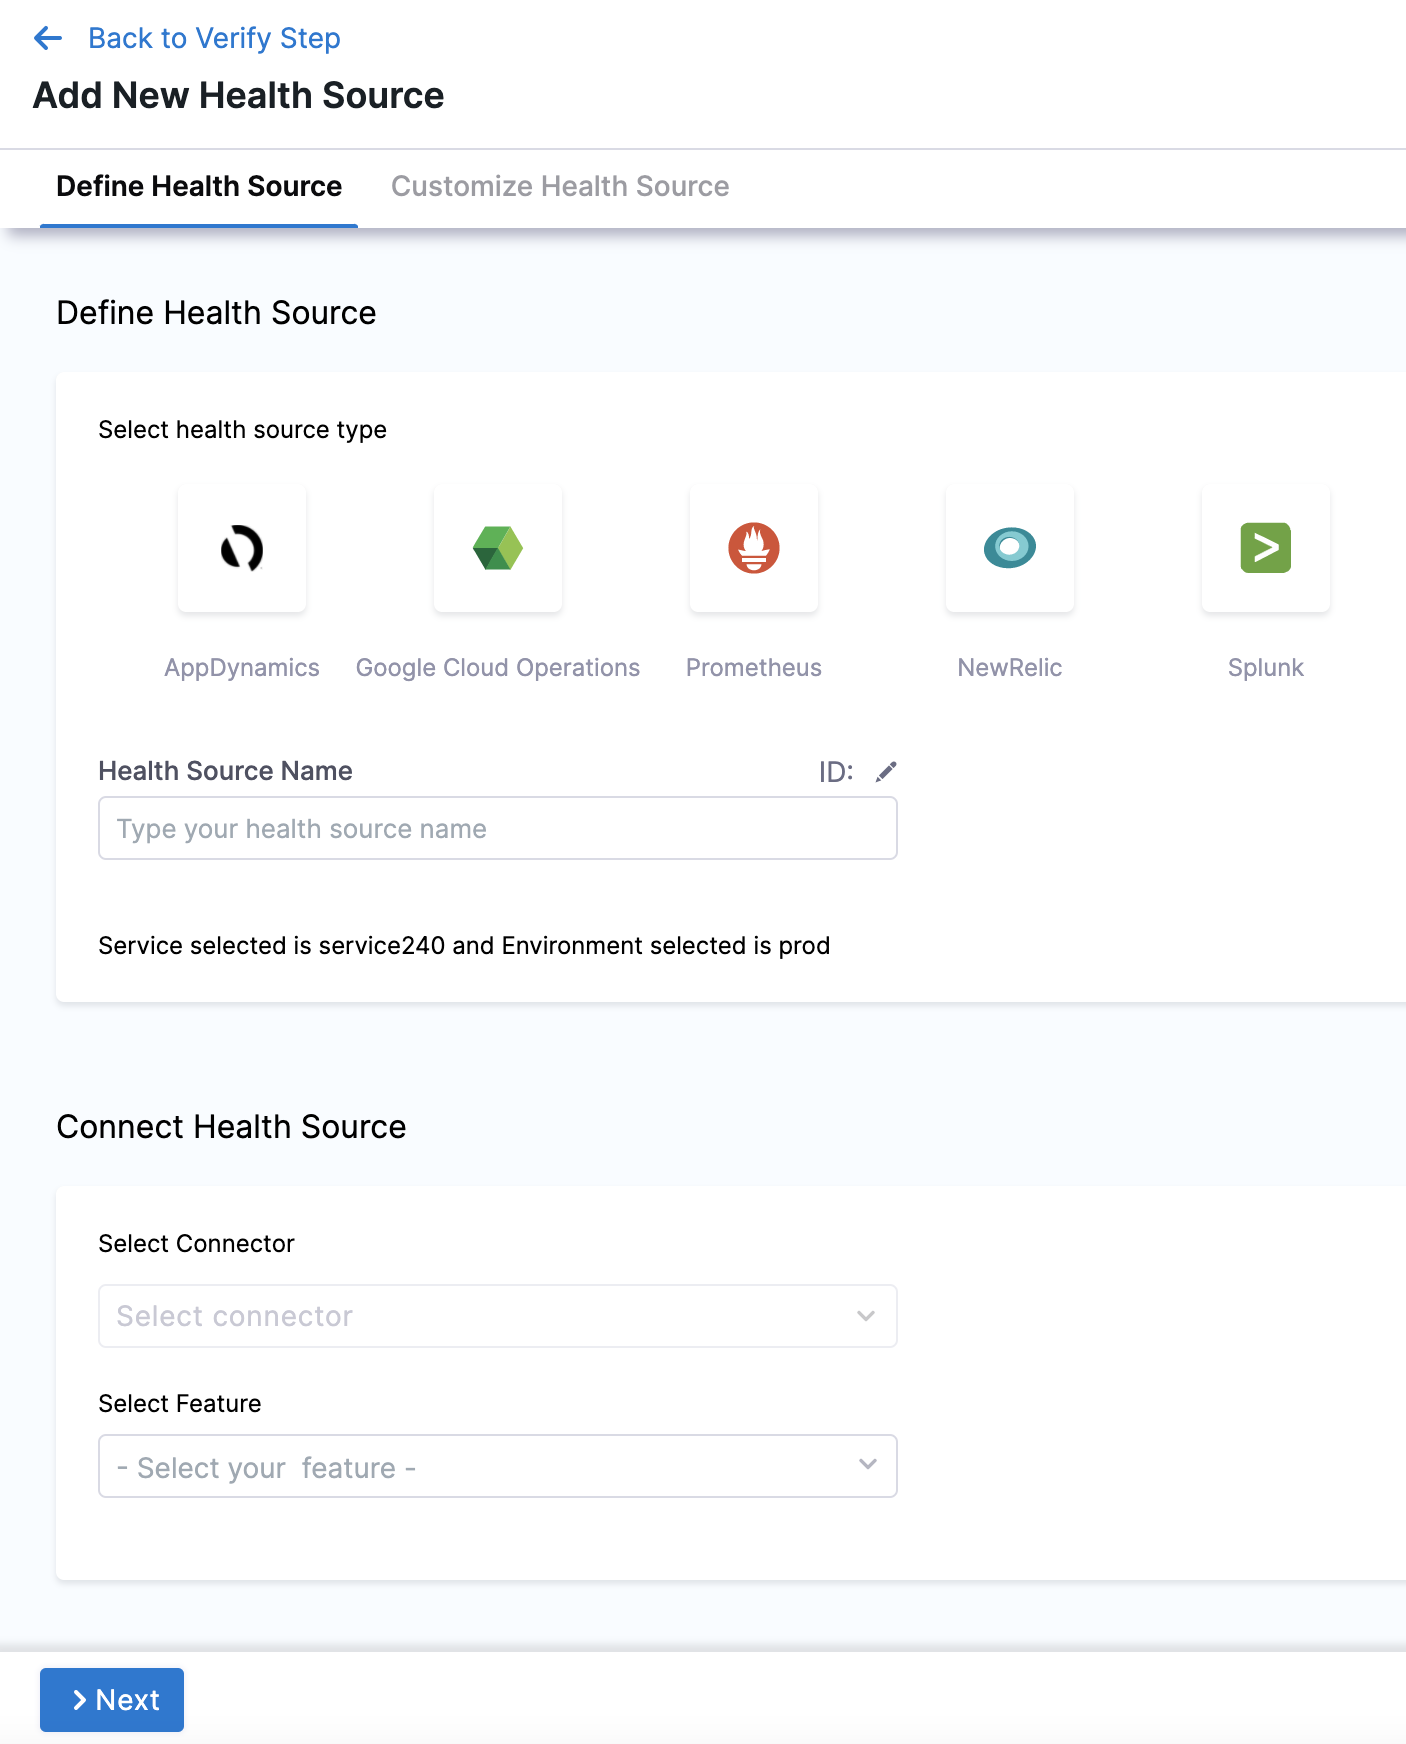
In Select health source type, select New Relic.
In Health Source Name, enter a name for the Health Source.
Under Connect Health Source, click Select Connector.
In Connector settings, you can either choose an existing connector or click New Connector.
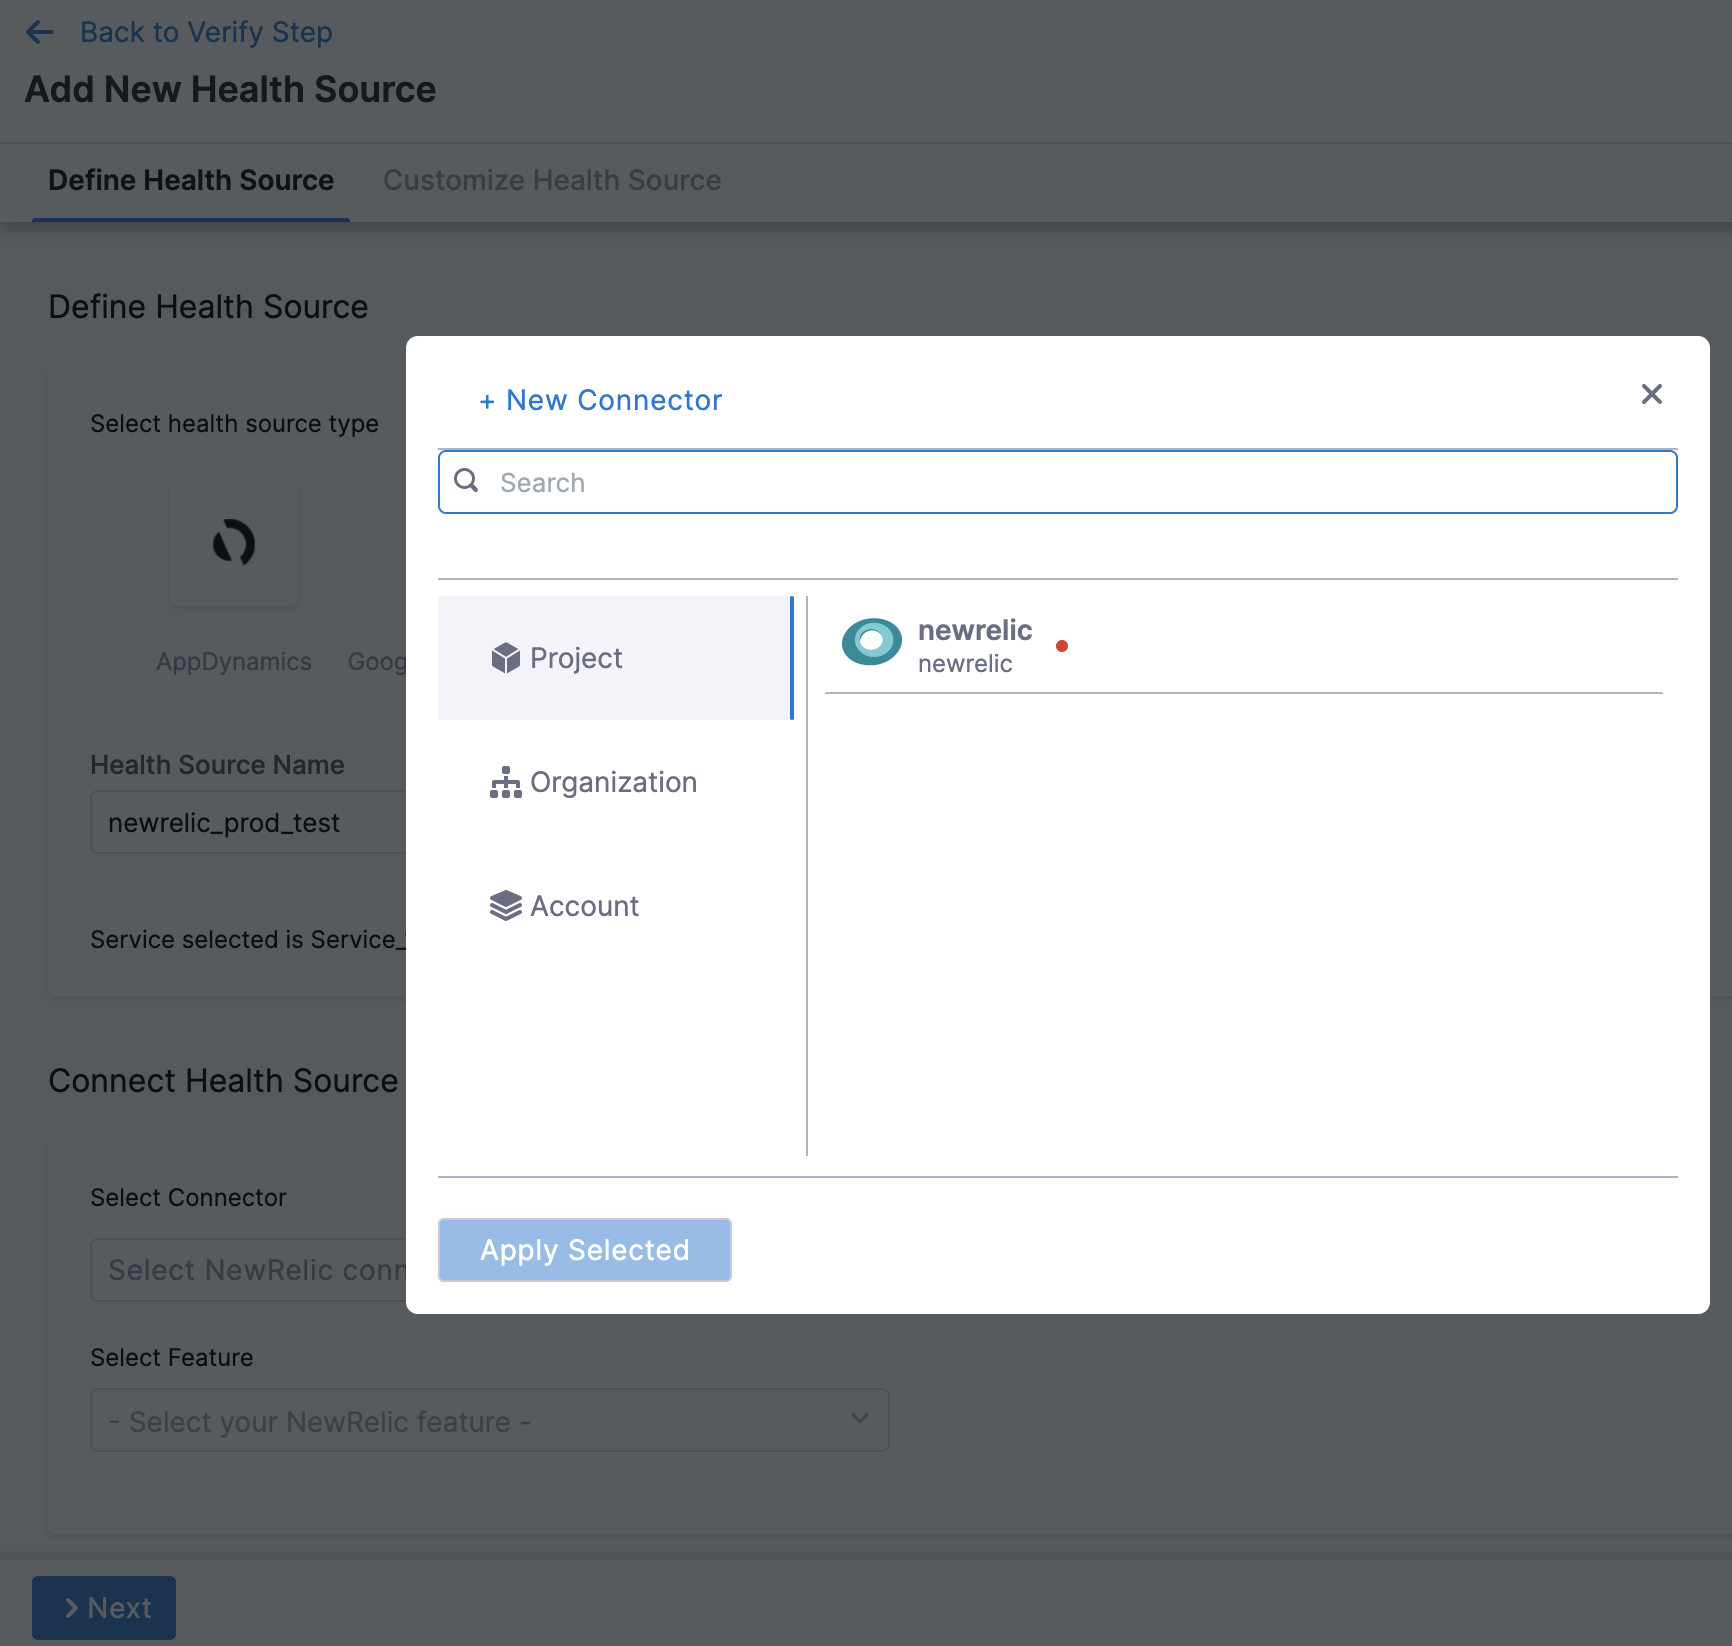
Click Apply Selected. The Connector is added to the Health Source.
In Select Feature, select the NewRelic feature to be used.
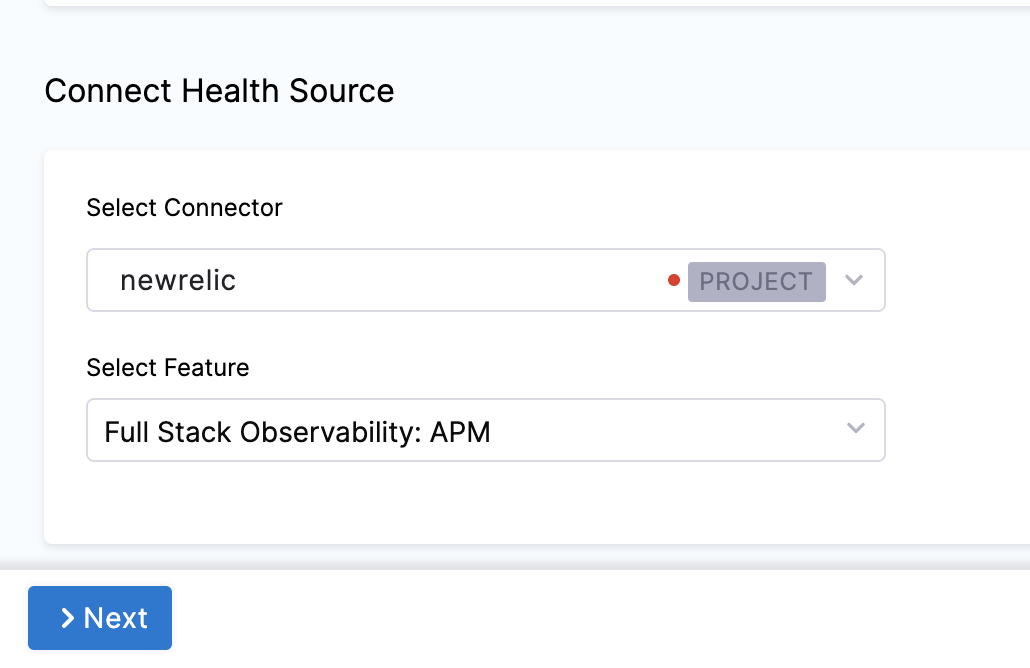
Click Next. The Customize Health Source settings appear. The subsequent settings in Customize Health Source depend on the Health Source Type you selected. You can customize the metrics to map the Harness Service to the monitored environment. In Applications & Tiers, enter the following details:
In Find a New Relic application type the name of an application.
In Find an AppDynamics tier type a tier name from which you want usage metrics, code exceptions, error conditions, or exit calls.
In Metric Packs select the metrics you want Harness to use.
Click Submit. The Health Source is displayed in the Verify step.
You can add one or more Health Sources for each APM or logging provider.
Step 6: Select Sensitivity
In Sensitivity, select High, Medium, or Low based on the risk level used as failure criteria during the deployment.
Step 7: Select Duration
Select how long you want Harness to analyze and monitor the logs/APM data points. Harness waits for 2-3 minutes to allow enough time for the data to be sent to the APM/logging tool before it analyzes the data. This wait time is a standard with monitoring tools.
The recommended Duration is 10 min for logging providers and 15 min for APM and infrastructure providers.
Step 8: Specify Artifact Tag
In Artifact Tag, use a Harness expression
The expression <+serviceConfig.artifacts.primary.tag> refers to the primary artifact.
Option: Advanced Settings
In Advanced, you can select the following options:
Step 9: Deploy and Review Results
After setting up the Verify step, click Apply Changes.
Click Run to run the pipeline.
In Run Pipeline, select the tag for the artifact if a tag was not added in the Artifact Details settings.
Click Run Pipeline.
When the Pipeline is running, click the Verify step. You can see that the verification takes a few minutes.
Once verification is complete, the Verify step shows the following:
The risk level might initially display a number of violations, but the red and orange colored host often change to green over the duration.
Summary
The Summary section shows the number of logs that are in violation.
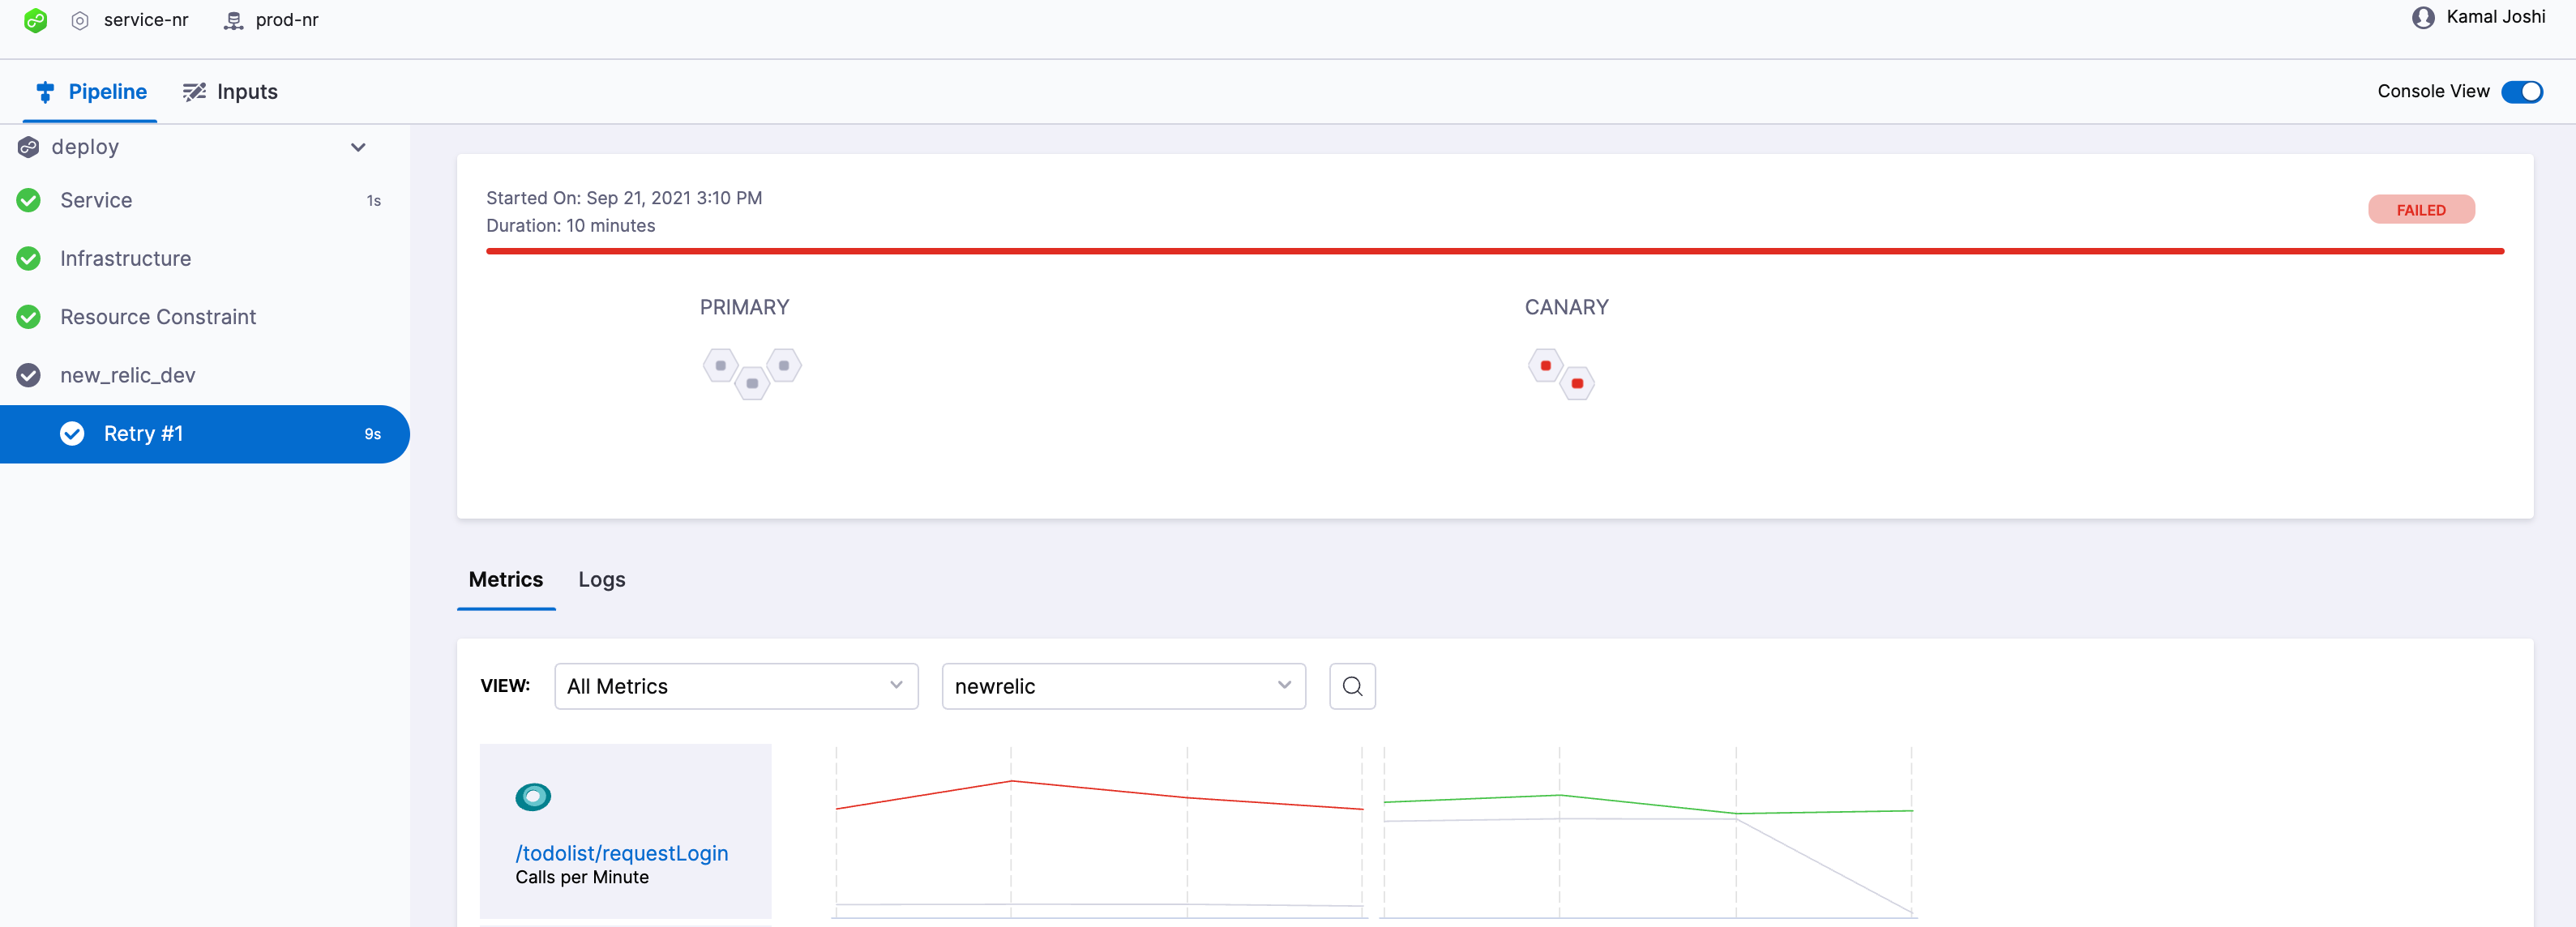
Console View
Click Console View or simply click View Details in Summary to take a deeper look at verification.
If you have more than one Health Source, you can use the View dropdown to select each one.
You can use the search option to search for any specific metric or transaction you want.