Service Reliability Management release notes
Review the notes below for details about recent changes to Harness Service Reliability Management, NextGen SaaS. For release notes for Harness Self-Managed Enterprise Edition, go to Self-Managed Enterprise Edition release notes.
Harness deploys changes to Harness SaaS clusters on a progressive basis. This means that the features and fixes that these release notes describe may not be immediately available in your cluster. To identify the cluster that hosts your account, go to the Account Overview page.
Latest - May 04, 2023, version 79214
- What's new
- Early access
- Fixed issues
- An icon appears on the SLO performance trend chart timeline to indicate when the error budget was reset and the amount of budget that was added. (SRM-14550)
This release does not include any early access features.
The Error Budget Burn Rate is above SLO notification setting was not triggering notifications, even when the condition was met. (SRM-14613)
This issue has been resolved and notifications are being triggered when the Error Budget Burn Rate is above condition is met.
Previous releases
2023 releases
April 22, 2023, version 79111
What's new
Added new advanced fields for consecutive error budges in SLO. These fields are optional. (SRM-14507)
Removed the mandatory check for the presence of Tier in the AppDynamics complete metric path. (SRM-14463)
Early access
This release does not include any early access features.
Fixed issues
The title in the expressions modal of health sources has been updated from Shell (Bash) to Query. (SRM-14478)
Monitored service cannot be deleted if it is created with an invalid connector. (SRM-14403)
To fix this issue, the UI connector component is now enabled when the provided connector is not found.
For CloudWatch CV connector, IRSA was not supported for connectivity. (SRM-13907)
Support for IRSA connectivity was added.
April 10, 2023, version 79015
What's new
Filters applied to the monitored services list on the Monitored Services page will get reset when you switch to a different project. (SRM-14383)
Early access
This release does not include any early access features.
Fixed issues
When switched to a different project while a template was open, the health sources from the previous template would remain visible in the template, even though they were not part of the new project. (SRM-12236)
This issue has been resolved. Now, when you switch to a different project while a template is open, you will be redirected to the templates listing page.
The SLO health summary cards displayed in a monitored service's health dashboard show summarized data for SLOs associated with all the monitored services in the project, even if the SLOs are not connected to the selected monitored service. (SRM-14462)
This issue has been resolved. Now, the SLO health summary cards displayed in a monitored service's health dashboard will show summarized data only for the SLOs associated with the selected monitored service.
March 31, 2023, version 78914
What's new
This release does not include any new features.
Early access
This release does not include any early access features.
Fixed issues
Monitored service creation fails when using a monitored service template that has Org or Account level service and environment. (SRM-14291)
This restriction is removed. Now, you can create a monitored service using a monitored service template with Org or Account level service and environment.
On the Monitored Services list page, a help panel appears for every monitored service listed. This is resulting in an overwhelming number of help panels that need to be closed individually. (SRM-14266)
This issue has been resolved. Now, only one help panel appears for all monitored services listed on the page.
SLO error budget notifications are being triggered even when the notification rule is disabled. (SRM-13997)
This issue has been resolved. Now, SLO error budget notifications are not triggered if the notification rule is disabled.
March 24, 2023, version 78817
What's new
- When you try editing an existing SLO, you will see the Tags (optional) field autopopulated even if no value was entered while creating the SLO. Harness uses the selected SLI type as value to autopopulate the Tags (optional) field. (SRM-14121)
- There is a new user interface (UI) for Elasticsearch health source configuration. This update is designed to improve the overall user experience and make it easier to configure Elasticsearch health sources. (SRM-14180)
Early access
This release does not include any early access features.
Fixed issues
The Time Window in the Service Health tab does not display the information for an event by default when accessed using the link in the event notification. Users had to manually search for the information by moving the Time Window to the event's date and time. (SRM-14071)
This issue has been resolved. The Time Window now displays the event information automatically when accessed using the link in the notification. Users no longer need to manually search for the information by moving the Time Window to the event's date and time.
Error encountered when setting up monitored service in verify step with Org or Account level service and environment. (SRM-14191)
This restriction is removed. You can create a monitored service in the verify step even if the service and environments are at the Org or Account level.
Unable to set the duration in the Verify step as an expression or use a value from other fields or variables. (SRM-13981)
This restriction has been removed. You can now set the Verify step duration using an expression or a value from other fields or variables.
If a monitored service is updated in an SLO, the Monitored Service List page does not display the updated information in the SLO/ERROR BUDGET column. Instead, it shows that the SLO is still linked to the previous monitored service. (SRM-14078)
This issue has been resolved, and the SLO/ERROR BUDGET column will now display the updated information when a monitored service is updated in an SLO.
The verify step fails when a monitored service is deleted and recreated within two hours with a different connector ID. (SRM-14021)
This issue has been resolved, and now the Verify step does not fail if the health source is deleted and recreated within 2 hours with a different connector ID.
If there is no data received from one of the metric packs while configuring AppDynamics as a health source, the validation fails.(SRM-13597)
This issue has been resolved. Now, the validation passes if there is incoming data from any one of the metric packs.
March 21, 2023
Fixed issues
- The Source Code tab on the Automated Root Cause (ARC) screen shows blank during decompilation of source code instrumented with JaCoCo. This issue has been fixed. (CET-1175)
- The impacted services values were shown as "0 Service(s)" in the Event list. This issue has been fixed. (CET-1136)
March 15, 2023, version 78712
What's new
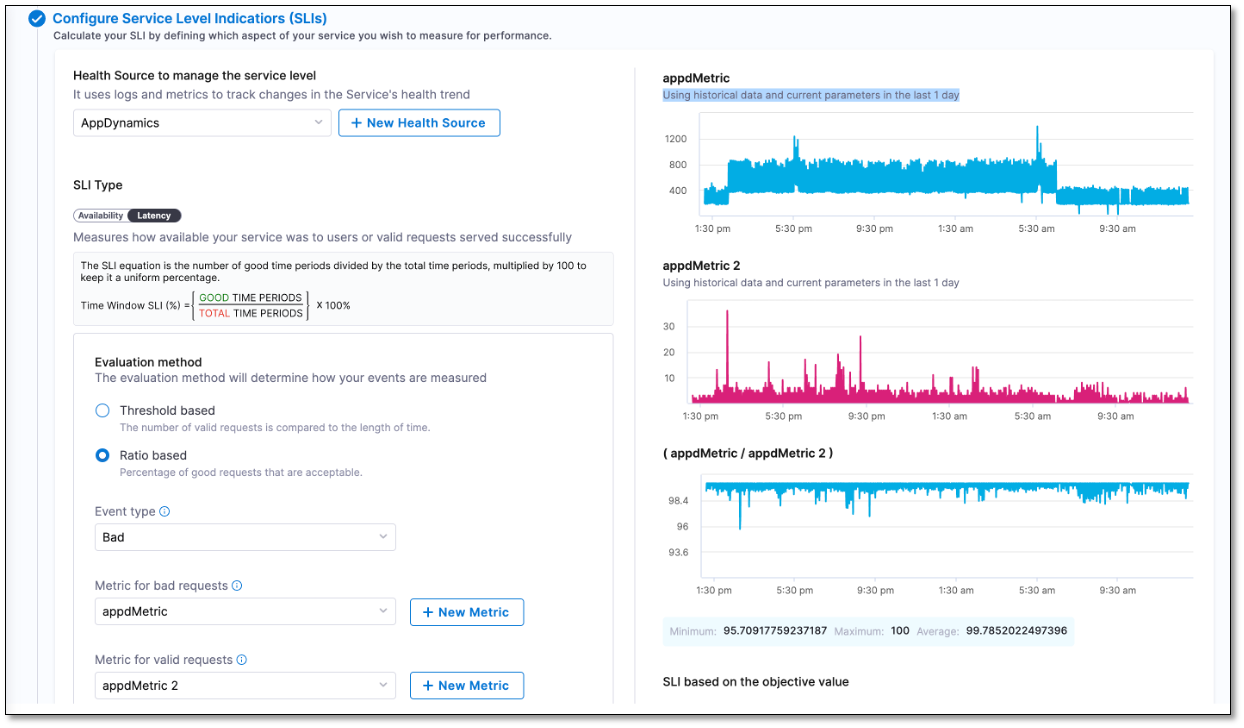
Metrics graphs are now added to the Create SLO screen. (SRM-14025)
When configuring Service Level Indicators (SLIs) in the Create SLO screen, you will now see a metric graph based on the last 24 hours of data received from your health monitoring tool. Additionally, the recommended minimum, maximum, and average values specific to the SLI parameter that you are configuring will be displayed.
This feature eliminates the need for switching between the Harness Create SLO screen and your health monitoring tool dashboard to determine the most appropriate value for the SLI parameter you are configuring. For instance, if you opt for the ratio-based evaluation method while configuring your SLI, you can refer to the metric graphs and accompanying suggested values to determine the ideal percentage of valid requests to be considered for your SLI.
Early access
This release does not include any early access features.
Fixed issues
Continuous Verification (CV) fails due to timestamp format difference. (SRM-14167)
This issue is fixed by updating the timestamp format in the API request.
Long Prometheus metric links overflow outside the METRIC NAME column and obstruct adjacent column values in the console view during pipeline runs. (SRM-14107)
This issue is fixed and the long Prometheus metric links are now contained within the METRIC NAME column, preventing them from obstructing values in the adjacent column.
After saving and reopening a monitored service template, the Save button remained enabled even if no changes are made. (SRM-14085)
This issue is fixed, and the Save button is now enabled only if changes are made to the monitored service template. Additionally, an unsaved changes alert now appears next to the Save button when changes are made to the template values.
March 8, 2023, version 78619
What's new
Specify metric thresholds in the monitored service template. (SRM-13972)
Now, you can specify metric thresholds for the health source when creating a monitored service template. This helps you predefine the metric thresholds and removes the hassle of specifying them every time you create a new monitored service.
Early access
This release does not include any early access features.
Fixed issues
This release does not include any fixed issues.
February 28, 2023
Early access
Standalone Error Tracking experience. (SRM-12696)
This release introduces the standalone Harness Error Tracking (ET) experience. With this, you can quickly start using ET by installing the ET Agent on your Java Virtual Machine (JVM) and configuring it with Harness SRM.
This feature is behind the feature flagSRM_ET_EXPERIMENTAL.
February 23, 2023, version 78507
This release does not include new features, early access features, and fixed issues.
February 15, 2023, version 78421
This release does not include new features, early access features, and fixed issues.
February 6, 2023, version 78321
This release does not include new features, early access features, and fixed issues.
January 17, 2023, version 78214
This release does not include new features, early access features, and fixed issues.
January 10, 2023, version 78105
What's new
This release does not include new features and enhancements.
Early access
This release does not include early access features.
Fixed issues
Saving the verify step in a stage template throws the
Invalid YAML. Can't find pipelineerror if the pipeline key is missing in YAML. (SRM-13320)You can now save the verify step in a stage template even if the pipeline key is missing in YAML.
Even though metric data is not available from the health source for a time period, the Overall Health Score timeline displays green bars and shows the service score as 100. (SRM-13336)
Now, on the Service Health page, the Overall Health Score timeline displays grey bars if metric data is unavailable from the health source for a specific time period. It does not show the health score.
2022 releases
December 22, 2022, version 77908
This release does not include new features, early access features, enhancements, and fixed issues.
December 13, 2022, version 77808
What's New
This release does not include new features.
Enhancements
This release does not include enhancements.
Early Access Features
Continuous Verification (CV) fails if the data for configured deployment strategy is not available. (SRM-12731)
Harness was automatically applying an alternate deployment strategy even if the required data for the deployment configured in the Verify step was not available.
Now, Harness does not automatically apply an alternate deployment strategy if the required data is not available. Instead, Harness fails the CV. Harness automatically applies an alternate deployment strategy only if you choose the Auto option in the Continuous Verification Type dropdown list when configuring the Verify step.
This feature is behind the feature flag SRM_LOG_HOST_SAMPLING_ENABLE.
Fixed Issues
This release does not include fixed issues.
December 7, 2022, version 77716
What's New
This release does not include new features.
Enhancements
Increased limit for number of PagerDuty services (SRM-13102)
The PagerDuty Service dropdown list, which displayed up to 25 services, can now display up to 100 services.
Early Access Features
This release does not include early access features.
Fixed Issues
Pipeline deployment throws an exception with the message RuntimeException: name cannot be more than 64 characters long. if the name of the monitored service exceeds 64 characters. (SRM-12811)
This restriction is removed. Now, the name of the monitored service can contain up to 128 characters.
November 29, 2022, version 77608
What's New
N/A
Enhancements
The user interface no longer allows you to configure invalid metric thresholds. (SRM-12386)
On the Customize Health Source tab, the following changes are made to the Advanced (Optional) configuration section:
Under the Ignore Thresholds settings, only the Less than option is available for the Percentage Deviation criteria. The Greater than option is removed.
Under the Fail-Fast Thresholds settings, only the Greater than option is available for the Percentage Deviation criteria. The Less than option is removed.
Early Access Features
N/A
Fixed Issues
When the metrics feature was selected for the Splunk health source, the Continuous Verification and Service Health options were getting selected by default, even though those options are not supported for Splunk. This was causing continuous verification to fail. (SRM-12793)
Now, if you select the metrics feature for the Splunk health service, the continuous verification and service health options are disabled. Only the SLI option is available.
Custom metric configuration for the Splunk and New Relic health sources fails if the Metric Value JSON Path and Timestamp Field/Locator JSON Path queries contain a period (.). (SRM-12552)
Now, the Metric Value JSON Path and Timestamp Field/Locator JSON Path queries are automatically wrapped with square brackets and single quotes. This prevents the custom metric configuration from failing even if your JSON path queries contain a period (.)
November 11, 2022, version 77433
What's New
N/A
Fixed Issues
N/A
Early Access
N/A
November 6, 2022, version 77317
What's New
N/A
Fixed Issues
N/A
Early Access
N/A
October 18, 2022, version 77116
What's New
N/A
Early Access
N/A
Fixed Issues
N/A
October 7, 2022, version 77025
What's New
N/A
Early Access
N/A
Fixed Issues
N/A
September 29, 2022, version 76921
What's New
N/A
Early Access
N/A
Fixed Issues
N/A
September 14, 2022, version 76708
What's New
N/A
Early Access
N/A
Fixed Issues
N/A
September 7th, 2022, version 76619
Fixed issues
Metric Threshold configurations are not persisted if the criteria is percentage deviation and lesser than is selected in fast-fail thresholds (SRM-11696)
Not able to update prometheus source (SRM-11578, ZD-33879)
August 31st, 2022, version 76518
Fixed issues
Error while setting up CV step in NG pipeline (SRM-11553, ZD-33562)
Updated ServiceMethodId when Dynatrace service is selected from dropdown.
August 25th, 2022, version 76425
No changes in this release.
August 18th, 2022, version 76321
Fixed issues
Request body place holders are not serialized properly unless surrounded by "" (SRM-11217)
The request body for custom log source was not getting serialized properly due to the treatment of numbers in Gson library which we use. By upgrading the version of the library, we now have support to customize this behavior. Now we have defined how a number will be deserialized.
This issue is now resolved.
Fix the text wrapping in Health Sources table in Verify step (SRM-11185)
August 8th, 2022, version 76128
Fixed issues
Fetching Audits and JSON DTO Issues in Audit List API (SRM-11140)
Sequence in which services are deleted when project is deleted was incorrect. Now while deleting the project we can see both Monitored service and SLO audits.
Monitored Service with New Relic health source displays error message “same identifier is used by multiple entities” even though there is no other health source with same Id (SRM-10999)
August 1, 2022, version 76030
Fixed issues
Verification is not happening correctly when we configure Monitored Service using templates (SRM-11097)
Verify step for Template type Monitored Service was not working due to a missing record in the database. For such use cases, we use a transient entity. Updated to code to support both transient and persisted entities.
July 18th, 2022, version 75921
Fixed issues
Data Collection for CustomLogs is failing in Verification step (SRM-11003)
The Custom Log Health Source feature was unable to collect and process the data in the Verify step. This feature uses different DSL scripts to collect log data and service instance (host) data. If the log data collection DSL can also provide the host data, we do not need the host data DSL explicitly. However, in this case, the log collection DSL was also being used to collect the host data, which led to a Type mismatch error during the data processing. By removing the use of log collection DSL as the host collection DSL, we are able to pull the host data from the log data itself and it also ceases the exception. This feature is now working correctly.
Creation of Custom Health Source Metrics for Service based is failing (SRM-11002)
The Custom Metric Source Health did not work if the data query type was of type Service. The issue was happening due to a validation on the field metricPath in the Json response mapping, which is not present for the given query type. The given field is now optional. This issue has been resolved.
GCP Metric Verify Step: Seeing null pointer exception in execution logs for GCP metric Health Source (SRM-10674)
Fixed a null pointer exception in data collection for verify step.
SLO: Not able to create an SLO with GCP as metrics (SRM-10594)
Adding better logging.
July 11th, 2022, version 75829
Fixed issues
Continuous Verification not appearing in Deployment Stage template (SRM-10934)
Continuous Verification step was not appearing. Continuous Verification step now appears.
Email Notification failing with invalid template message (SRM-10923)
Added the message body into a string and formatted with HTML.
SLO says "recalculating" for over a day (SRM-10864)
Continuous Verification filter taking default monitored service for configured and template use case (SRM-10839)
Implemented Continuous Verification filter logic for configured and template use case.
Custom Health Host Metric data collection not collecting data for all hosts (SRM-10831)
Prometheus Continuous Verification perpetual task failing (SRM-10829) Caused by comparability issues in decrypting data. Handling it gracefully now. Fixed compatibility issues with perpetual task.